Detailed instructions on setting up and utilizing the journal, along with a features presentation.
Sale!


TRADING JOURNAL SPREADSHEET
Original price was: $200,00.$19,99Current price is: $19,99.
90% OFF
Limited Time Offer
Get the complete Trading Journal at a fraction of the original price.
The Ultimate Trading Companion for All Traders
1
Get Two Free PDFs
2
One-Time Payment
No hidden fees or subscriptions. Pay once, use forever.
3
Compatible with Office 2016+
Microsoft Office 2016 or newer version required.
4
No Microsoft Office?
Download Office 2019 and get an affordable license key (~$5).
Pay with Card or PayPal: click Add to Cart
Quick checkout with Link: use the button below
Description
90% OFF Whether you’re a complete beginner or an advanced trader, the COT Reports Trading Journal is designed to help you take your trading to the next level!
COT Reports Trading Journal Spreadsheet 2025
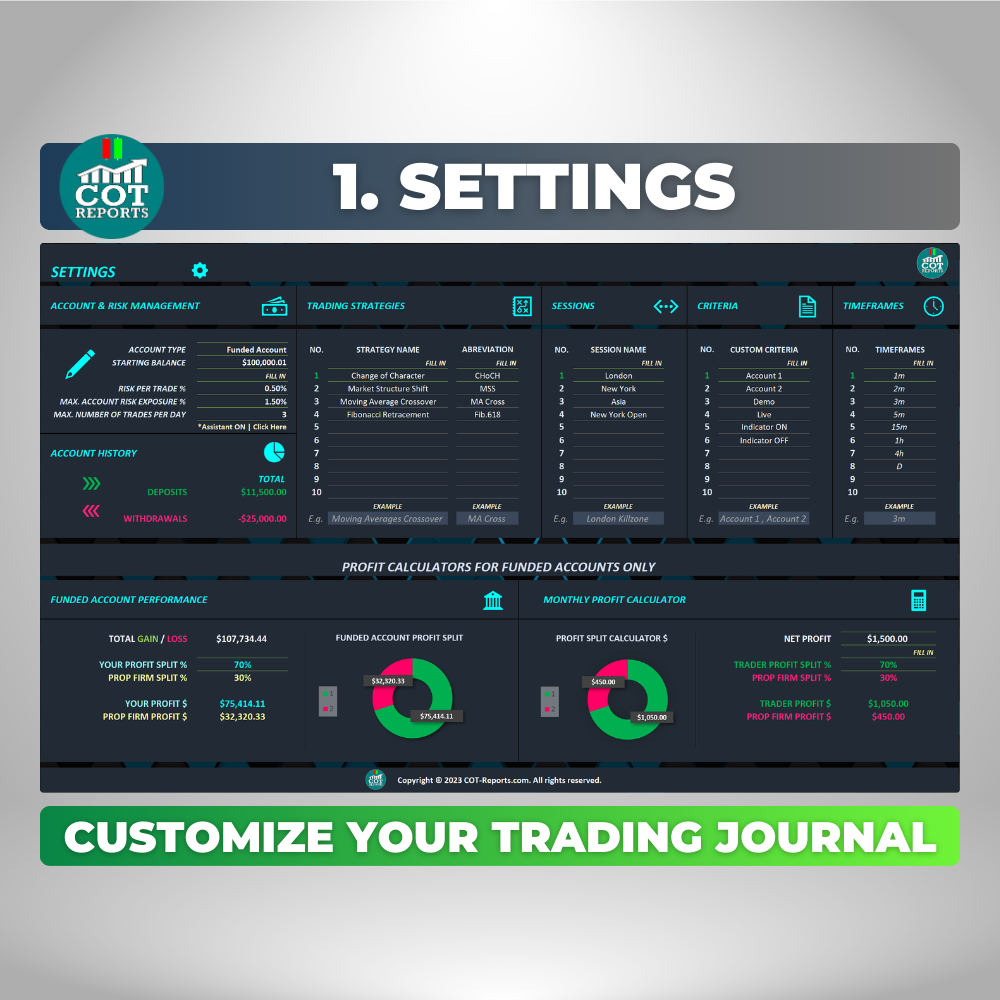
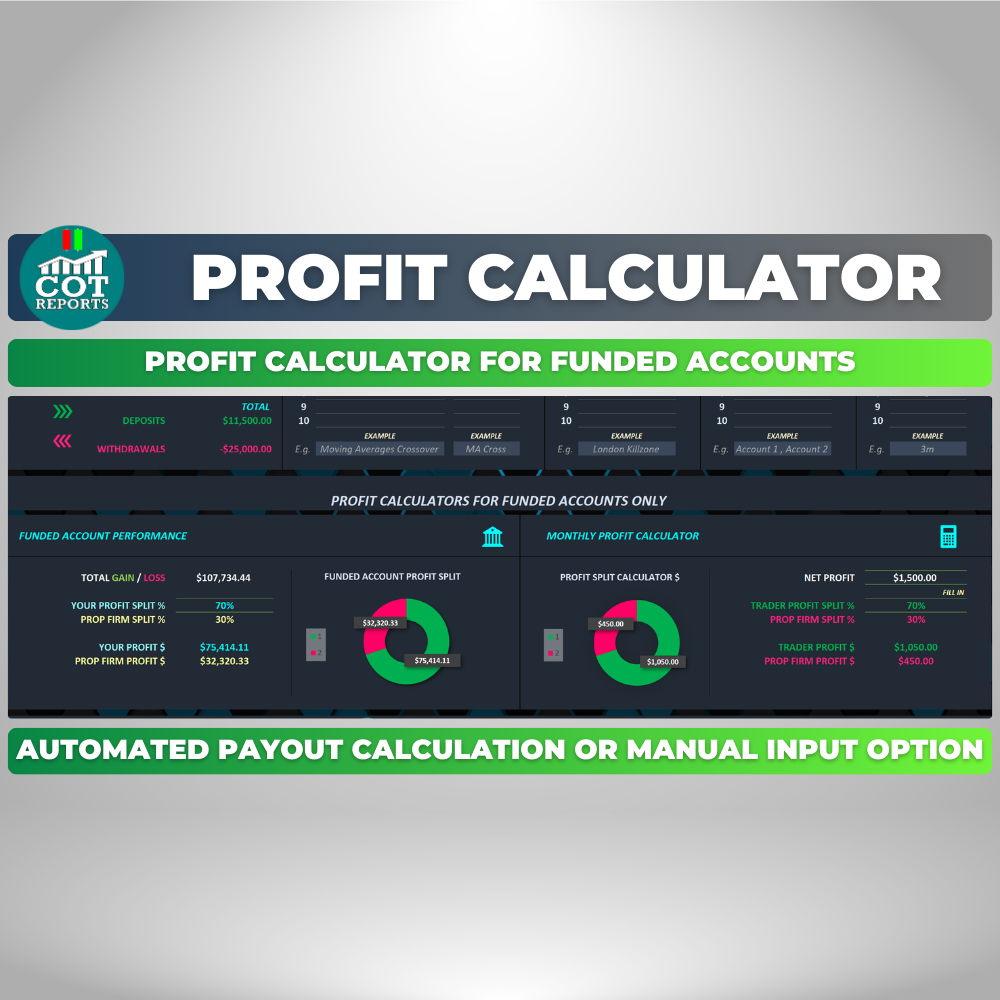
With just a few clicks, you can input all the relevant information about a trade, such as position type, risk percentage, risk type, strategy, timeframe and sessions.
The Trading Journal Spreadsheet automatically calculates important metrics for you, such as your profit or loss, return on investment, and much more. It’s simple, efficient, and accurate.
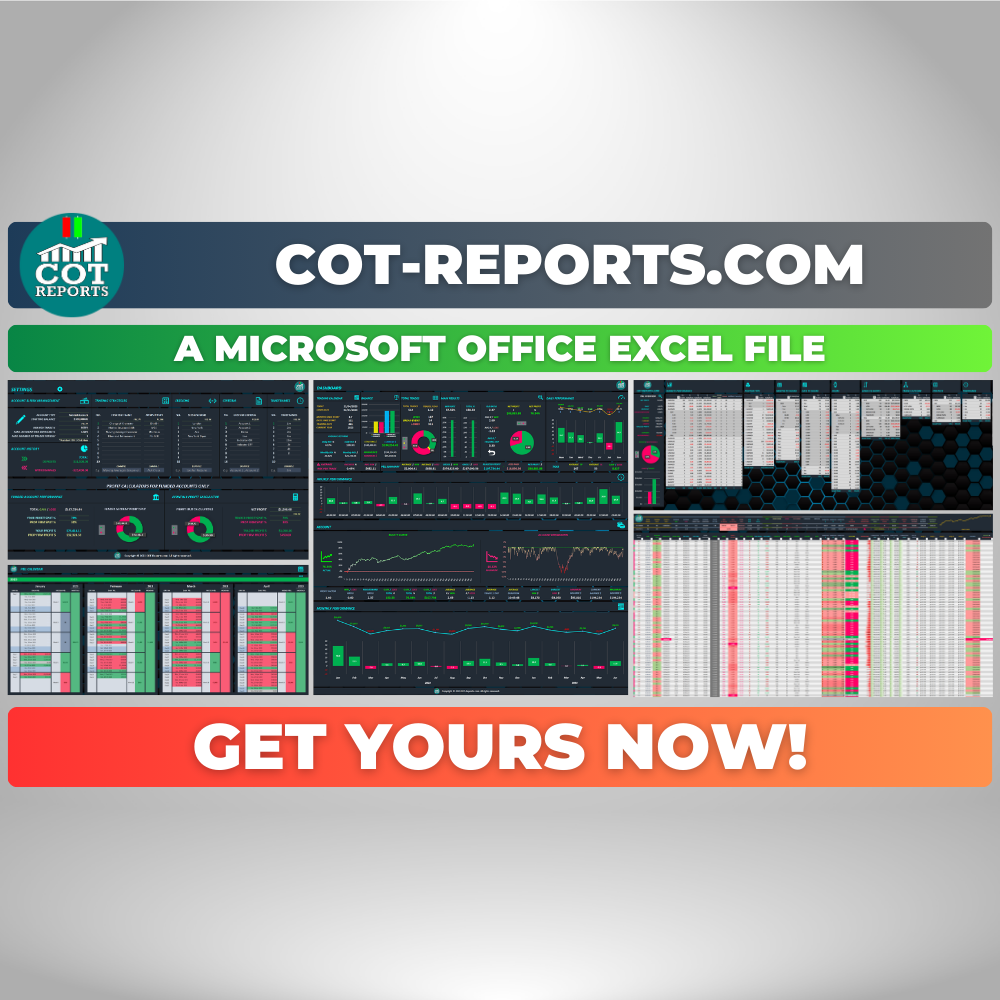
The File Consists of Four Powerful Sheets
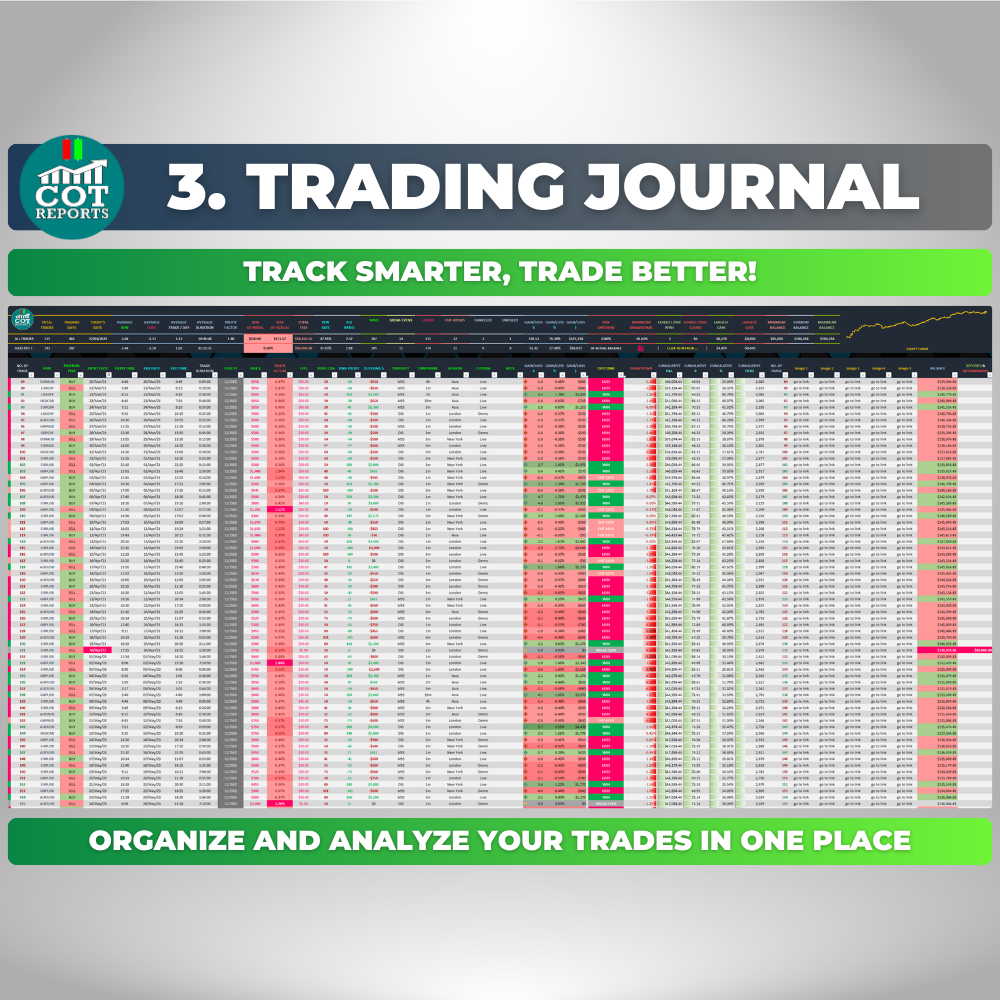
1. Trading Journal
Comprehensive dashboard at the top of the page for effortless trade tracking and real-time results.
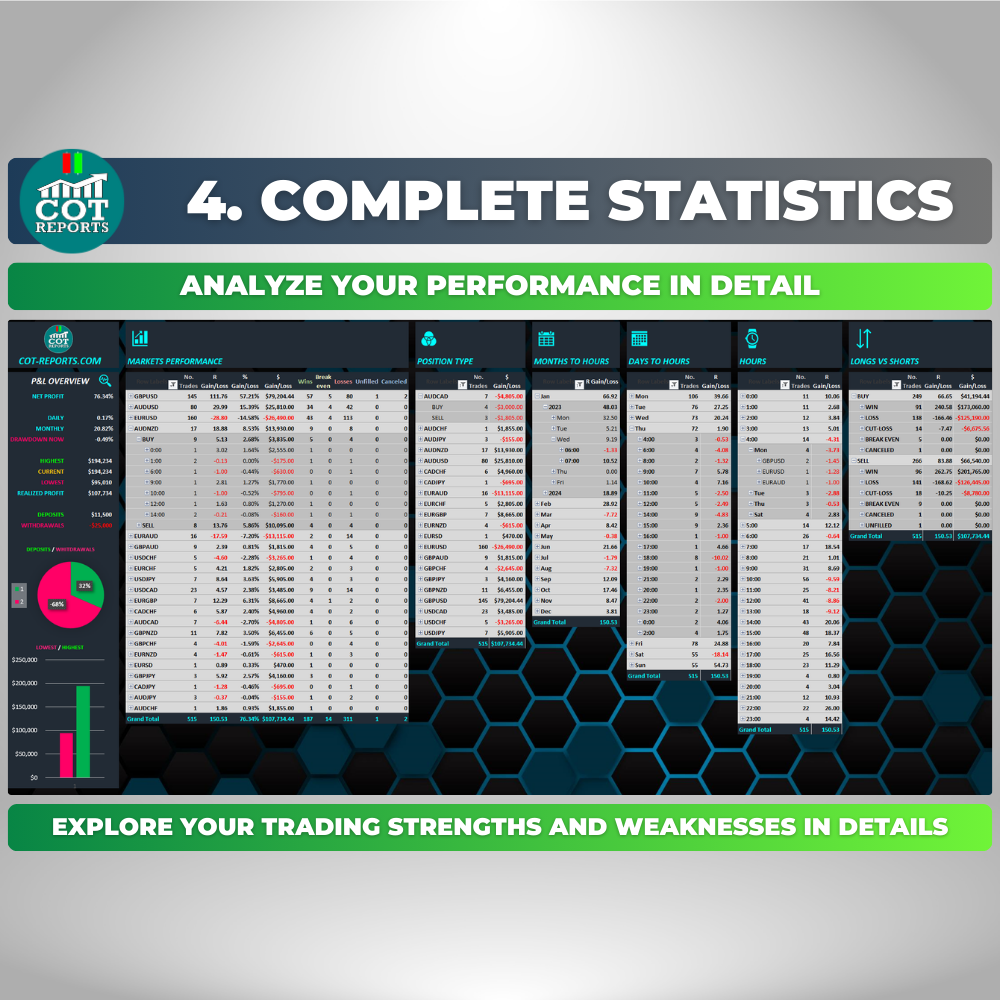
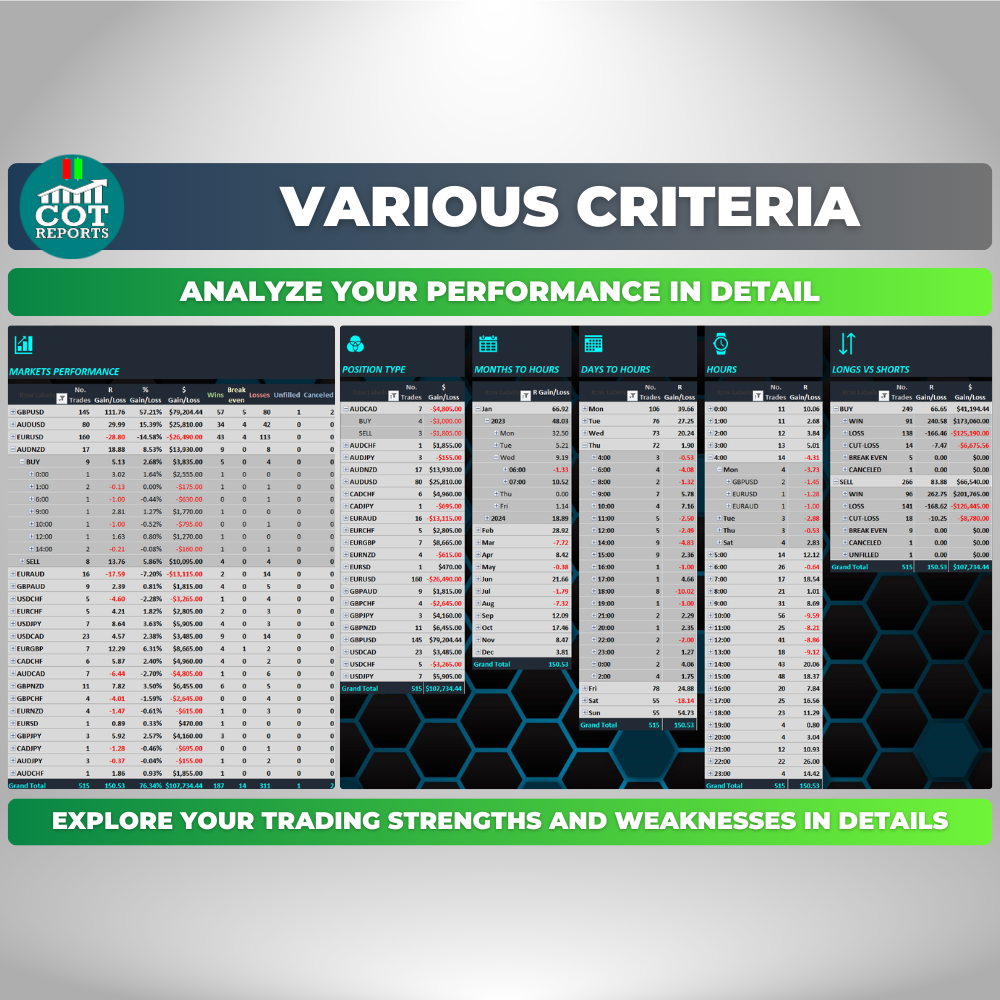
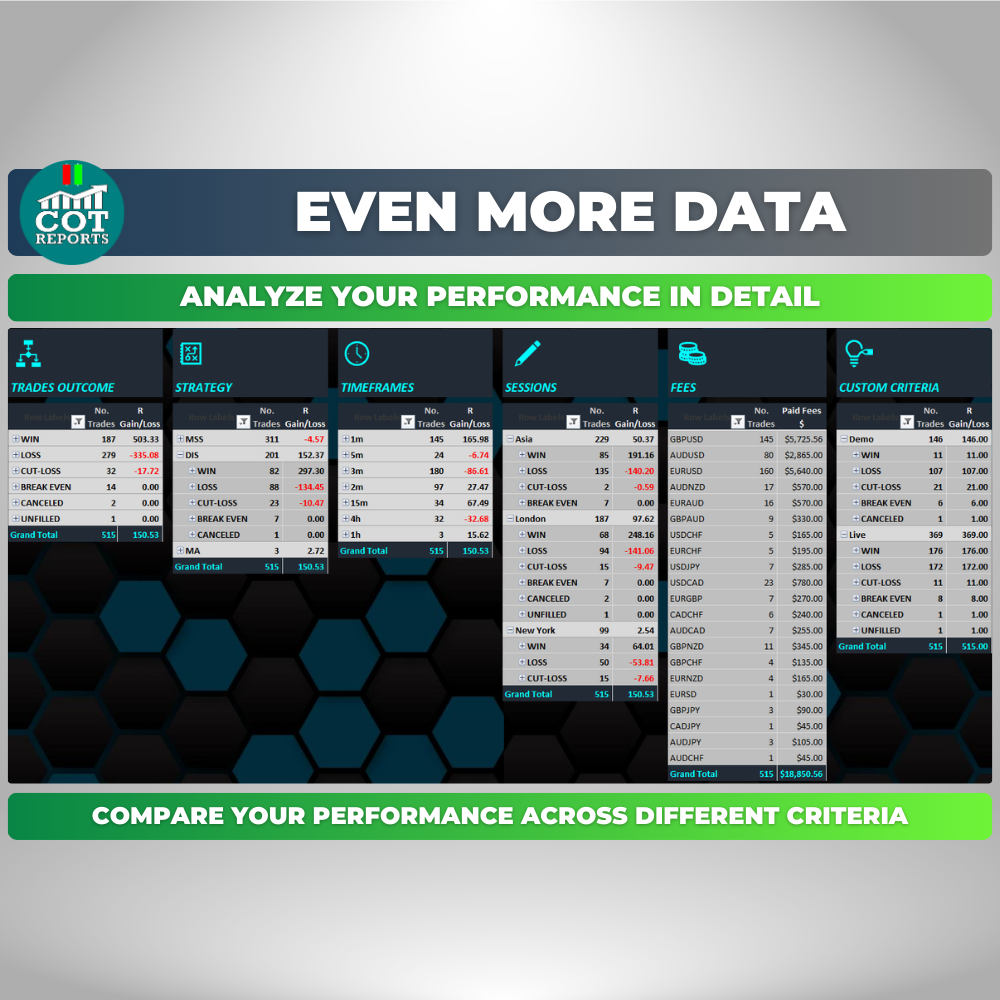
2. Complete Statistics
Pivot tables presenting data on strategies, markets, position types, days, hours, and outcomes.
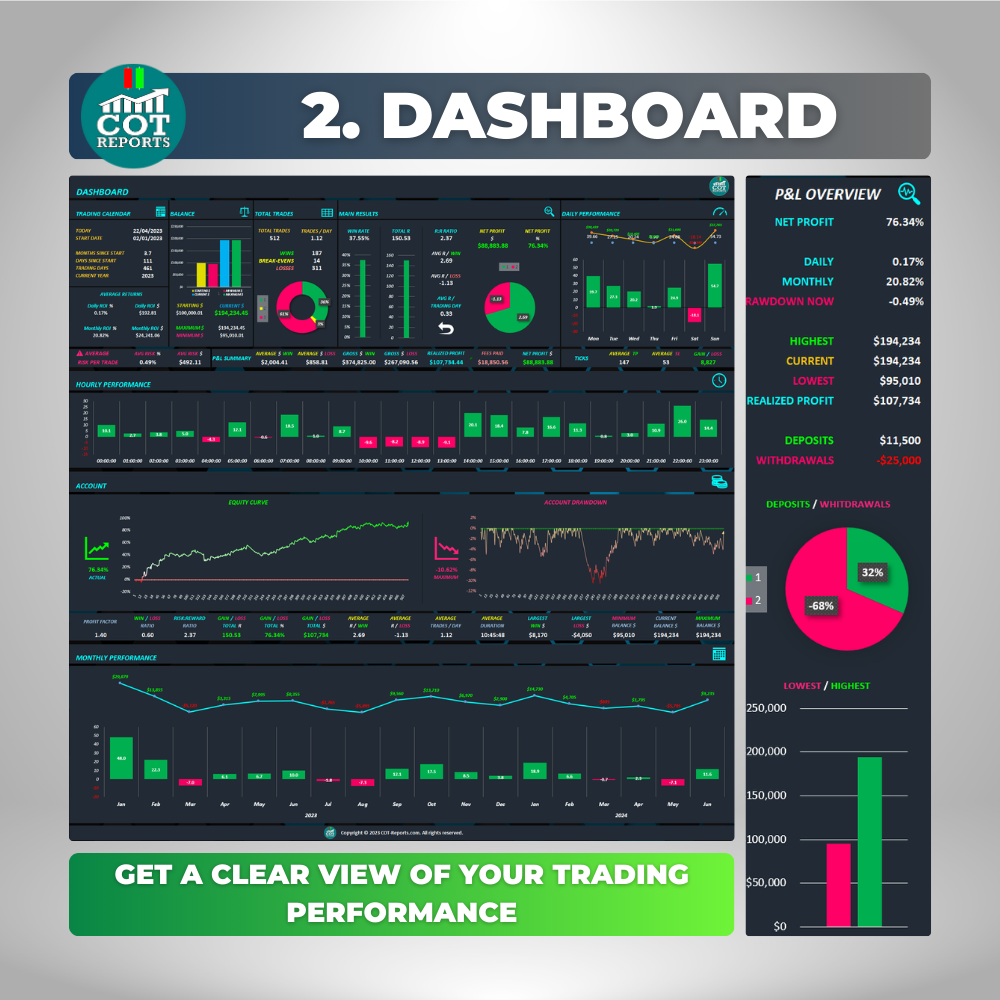
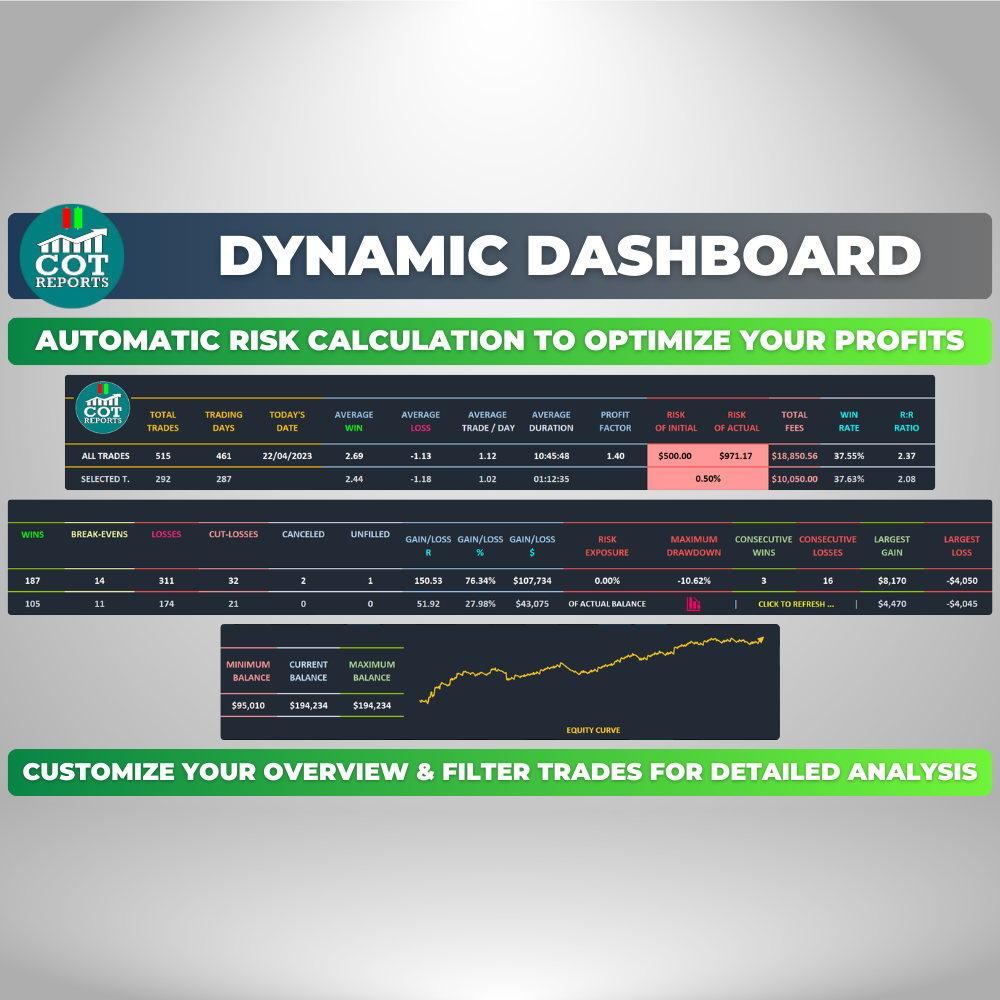
3. Dashboard
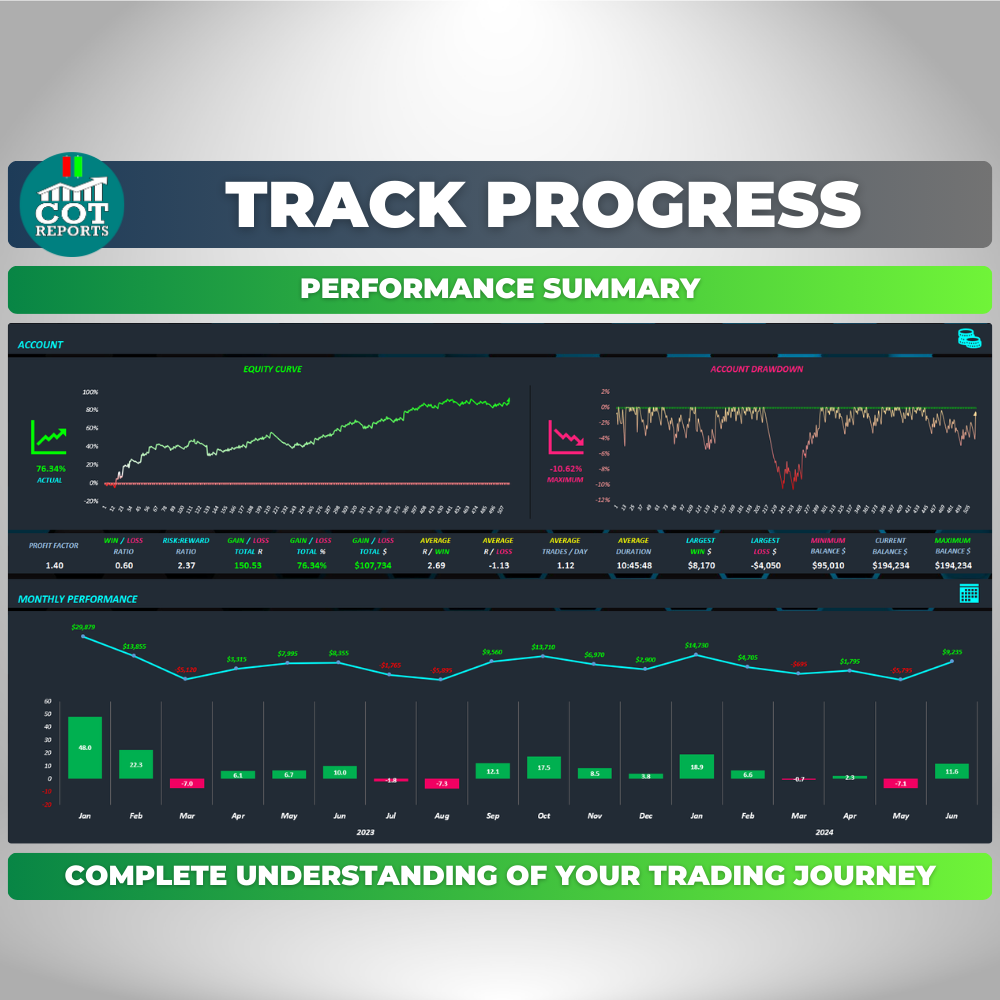
Hourly, daily, and monthly performance, equity curve, historical drawdown through visual charts.
4. P&L Calendar
Results filtered by years, months, days. Monitor your progress over time conveniently.
The Ultimate Trading Companion
The COT Reports Trading Journal Spreadsheet is a must-have tool for traders looking to track and analyze their performance effectively.
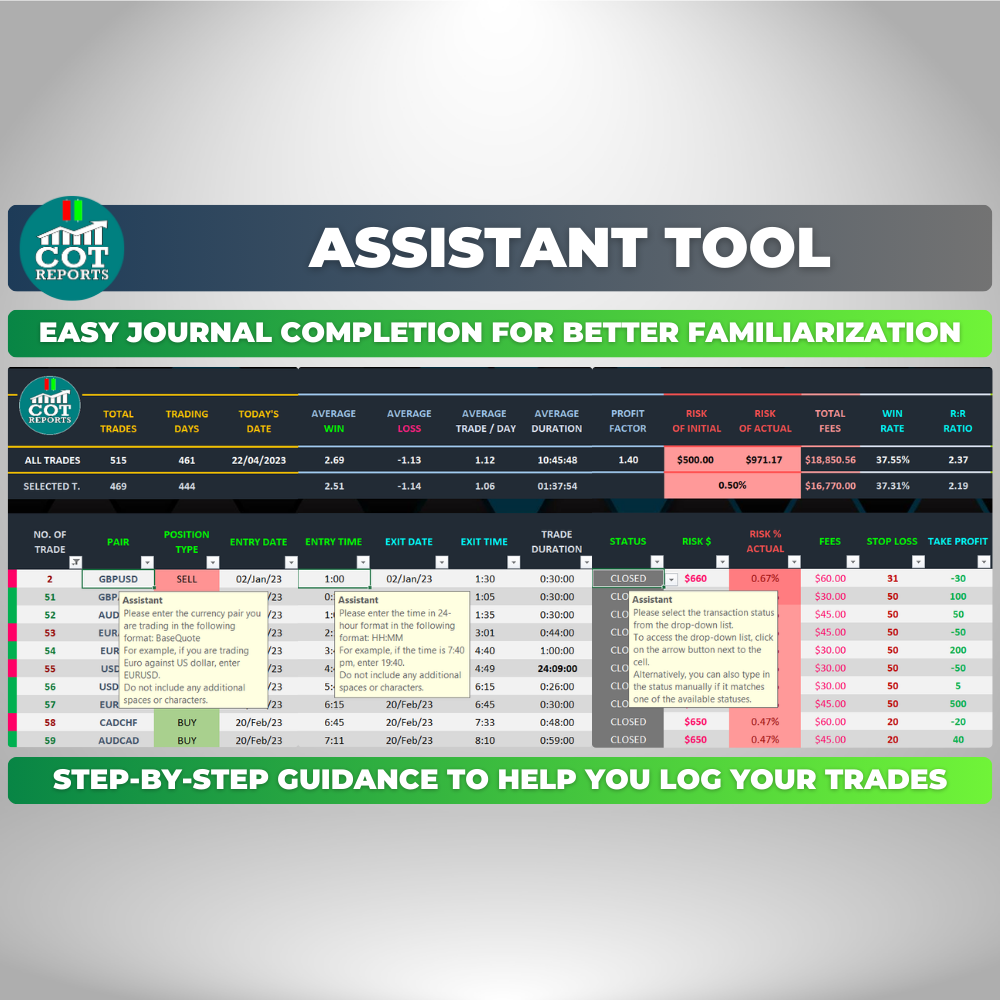
Assistant Feature
Step-by-step guidance for setting up, customizing, and filling in your first five trades.
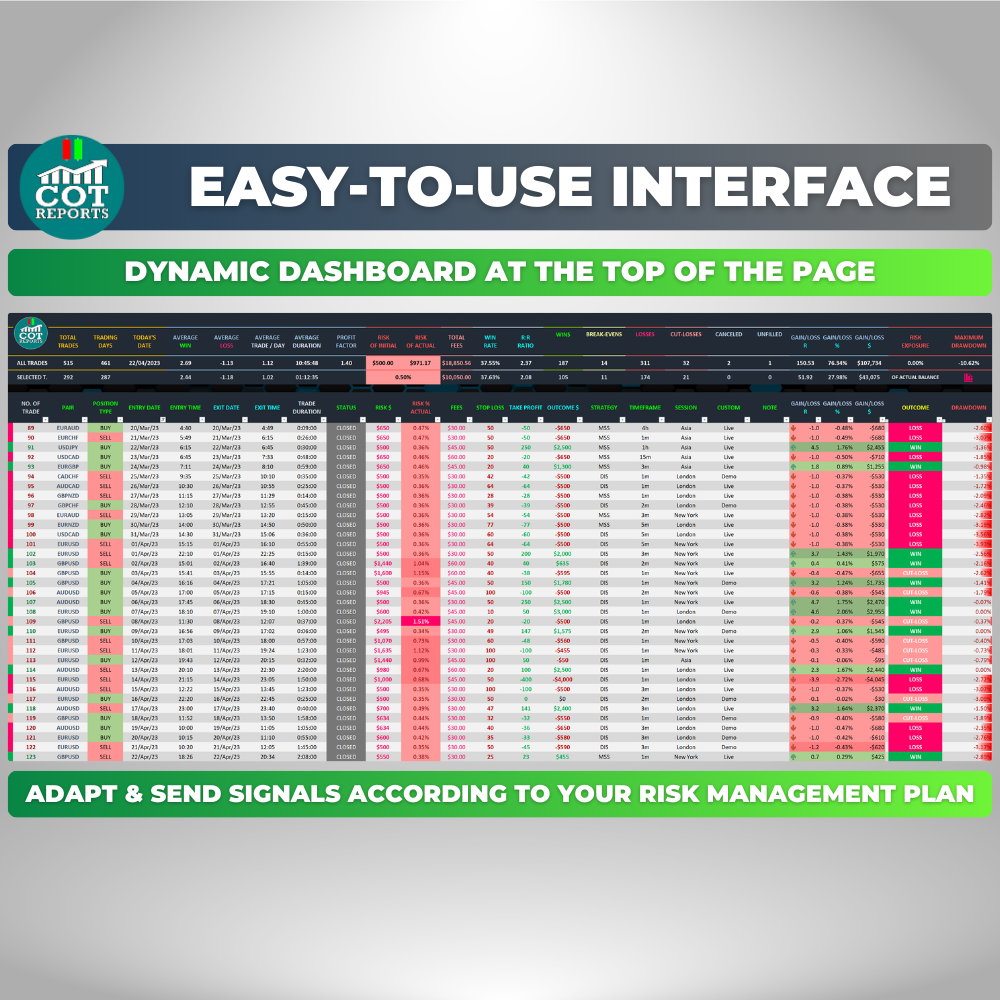
User-Friendly Interface
Intuitive layout with strategic use of colors for immediate insights into outcomes.
Strong Risk Management
Alerts if risking too much, dynamically adjusts risk based on account balance.
Dashboard Overview
Monitor account balance, track losses, analyze performance on daily, hourly, monthly timeframes.
Performance Charts
Daily and hourly charts, Equity Curve and Account Drawdowns visualization.
Complete Statistics Sheet
In-depth analysis across different markets, time periods, and customizable criteria.
P&L Calendar
Yearly, monthly, weekly, daily analysis with automatic coloration for profitability.
Powerful Tool for All Traders
Identify patterns, fine-tune strategies, and make better trades based on your performance data.