Trading Journal
Spreadsheet
Track your trades with clarity and consistency using our downloadable trading journal.
What Traders Are Saying
Valuable Trading Product
“A valuable tool for any trader looking to improve their performance. Highly recommend!”
Wonderful Attention to the Client
“The customer support is excellent. Every question I had was answered promptly and professionally.”
Very Intuitive and Easy to Use
“I was able to start using it right away without any learning curve. Everything is where you’d expect it to be.”
Your Journal Is Amazing
“The level of detail in the statistics is incredible. I can finally see patterns I was missing before.”
I Wish All Beginners Can Have This
“This would have saved me so many mistakes when I started trading. Essential for new traders!”
Incredible Tool
“The equity curve and drawdown charts are exactly what I needed to track my progress over time.”
It’s Mind-Blowing
“I’ve never seen such comprehensive statistics in a trading journal before. Absolutely blown away!”
A Powerful Trading Tool
“The pivot tables and market comparison features are game changers for my analysis.”
Best Trading Journal
“I’ve tried many journals – this is by far the best one. Worth every penny!”
Achieve profitability by getting a complete overview of your trading activities! Many traders possess strong technical analysis skills, but without a solid risk management plan and a clear understanding of their trading performance, they fail. Avoid the mistake of falling into the hamster wheel, where you keep making the same mistakes without progress. Get your copy today to boost your trading – an essential tool for any serious trader.
“Trading Journal Presentation
Watch a complete walkthrough of all features and learn how to get the most out of your trading journal.
Features
Whether you’re a complete beginner or an advanced trader, this trading journal spreadsheet is designed to help you take your trading to the next level. It’s packed with 4 powerful sheets and many features that make it easy to track your performance, analyze your trades, and more.
For Beginners
An excellent way to get started on the right foot by providing a detailed analysis of your trading history and identifying patterns and areas for improvement.
For Advanced Traders
Fine-tune your strategies and make better trades by having a complete overview of your past performance with advanced statistics.
Customizable Criteria
The Settings sheet allows you to customize your journal with strategy names, session names, up to 10 custom criteria, and timeframes.
Complete Tracking
Record your trades and thoughts, document your risk management. Everything you need to evaluate your trading performance accurately and objectively.
Your Data Stays Private
No cloud subscriptions. Your trading data stays on your computer, always. This is an Excel file, not a web service.
One-Time Payment
You only need to make a one-time payment; there are no hidden fees or subscriptions. Buy once, use forever.
Dashboard, Trading Journal, Complete Statistics & P&L Calendar
Dashboard
Trading Calendar, Balance, Total Trades, Main Results, Daily Performance & More
Trading Journal
Complex Dynamic Dashboard, Trade-by-Trade Journaling with Assistant Feature
Complete Statistics
Detailed Market Comparison, Daily/Hourly/Monthly Performance with Pivot Tables
P&L Calendar
The Perfect Tool for Keeping Track of Your Past Trading Results
Dashboard Overview
Trading Calendar, Balance, Total Trades, Main Results, Daily Performance & More
The Trading Journal Top Dashboard gives you a clear overview of your trading performance. You’ll find several tabs with important information, including the Trading Calendar, Balance, Total Trades, and Main Results. These tabs provide details on your trading activity, account balance, number of trades, win-rate, R:R ratio, and more. The daily performance graph shows the trader’s net profit or loss for each day. This allows the trader to identify any patterns in their performance that may be linked to specific days of the week.
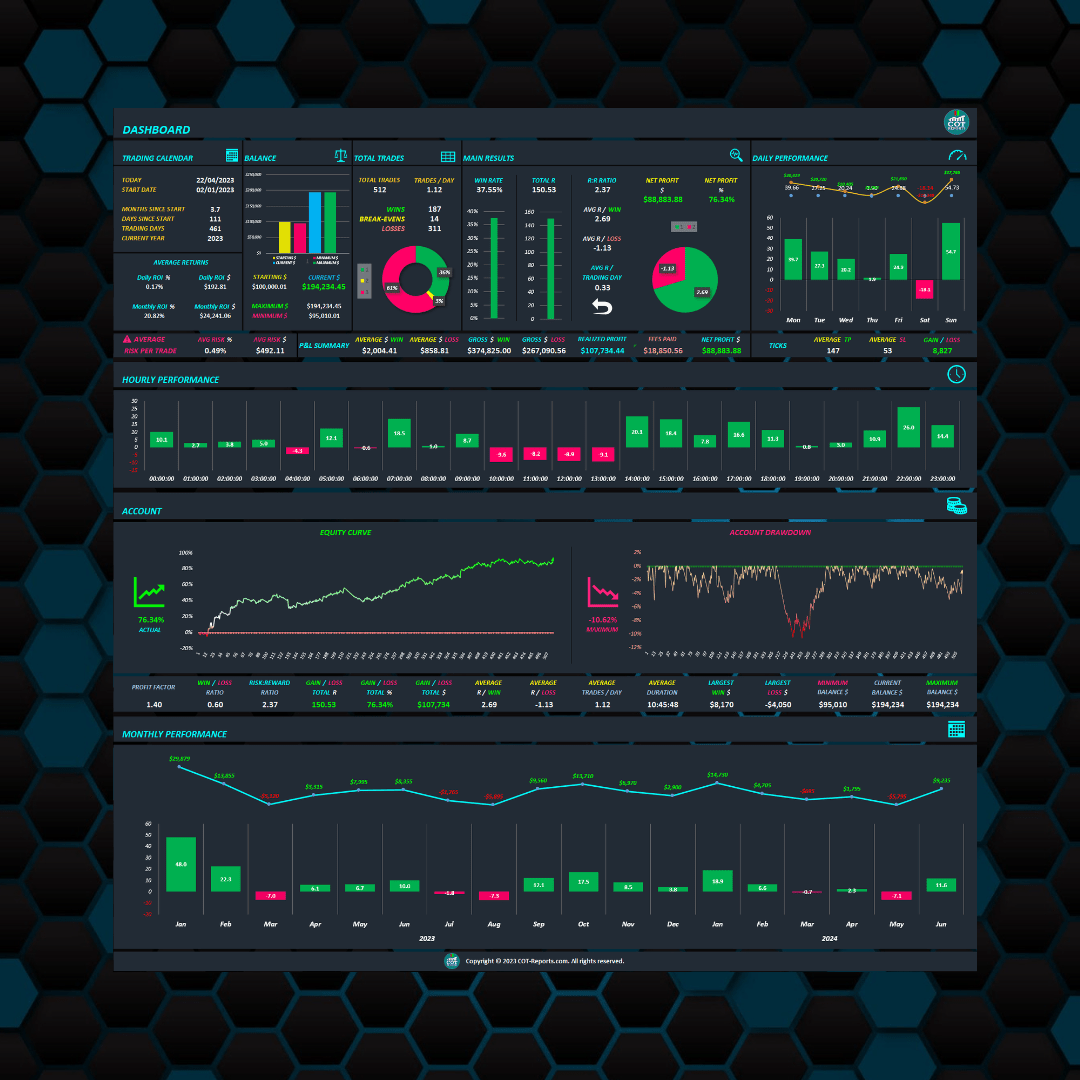
Hourly Trading Performance, Equity Curve, Account Drawdowns & More
The hourly performance graph displays the trader’s net profit or loss for each hour of trading. This allows the trader to identify any specific times of the day when they tend to do well or poorly. The equity curve graph shows the growth of the trader’s account over time. This allows the trader to see how their performance has improved or worsened over time. The historical drawdown graph shows the trader’s maximum drawdown over a given period of time.
Monthly Performance
Adapting the risk after each trade has several advantages. By risking a percentage of the actual account balance instead of the initial balance, traders can reduce the impact of drawdowns on their account. This helps to protect the account and trade with more confidence, knowing that they are always managing their risk appropriately. Additionally, compounding after each trade increases profits over time.
Trading Journal Sheet
The Trading Journal sheet will allow you to easily track and analyze your trades, giving you a clear picture of your performance and helping you identify what works and what doesn’t.
Complex Dynamic Dashboard at the Top of the Trading Journal

Journaling Trade by Trade
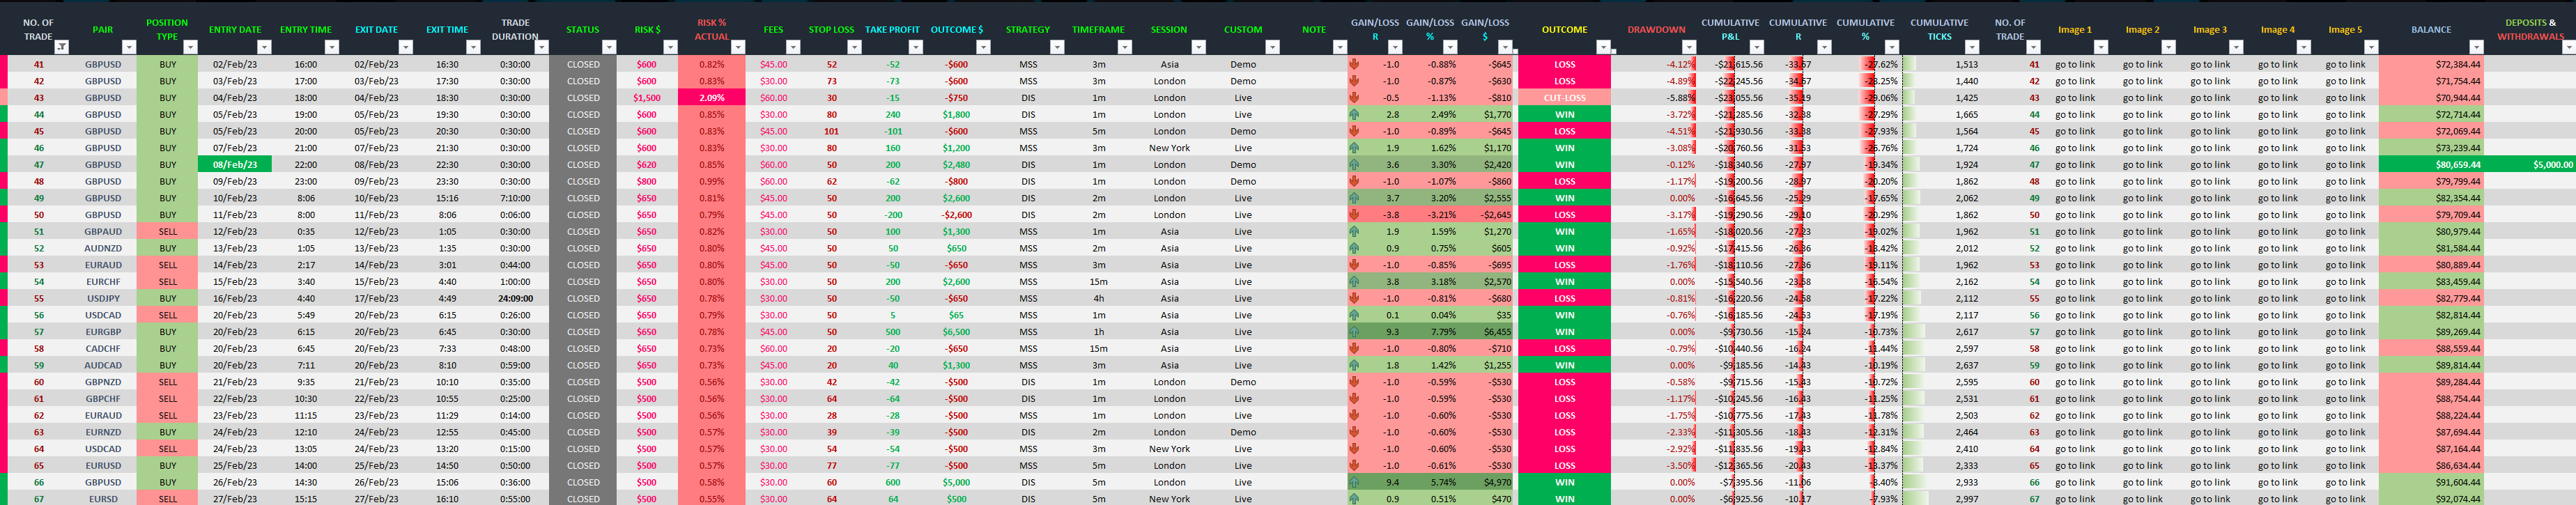
Easily Start Journaling Your Trades with the Assistant Feature
The feature guides traders through the first 5 trades by providing instructions for each field clicked on, ensuring all necessary information is recorded accurately.

Complete Statistics Sheet
The “Complete Statistics” sheet offers a wealth of detailed information about the markets you trade in.
It provides a clear comparison between traded markets, displaying daily, hourly and monthly performance. This sheet is the perfect tool for treating trading like a business. It gives you a clear picture of your performance, allowing you to make data-driven decisions. It’s all about the numbers on this sheet, it gives you an easy and quick way to analyze your performance.
This sheet makes it easy for you to identify which trades are working and which ones aren’t. This information allows you to focus on taking more of the trades that work and eliminate the ones that don’t work, resulting in more consistent and profitable trading results. Also, the ‘Complete Statistics’ sheet allows you to track and compare different markets, strategies, position types, and more.

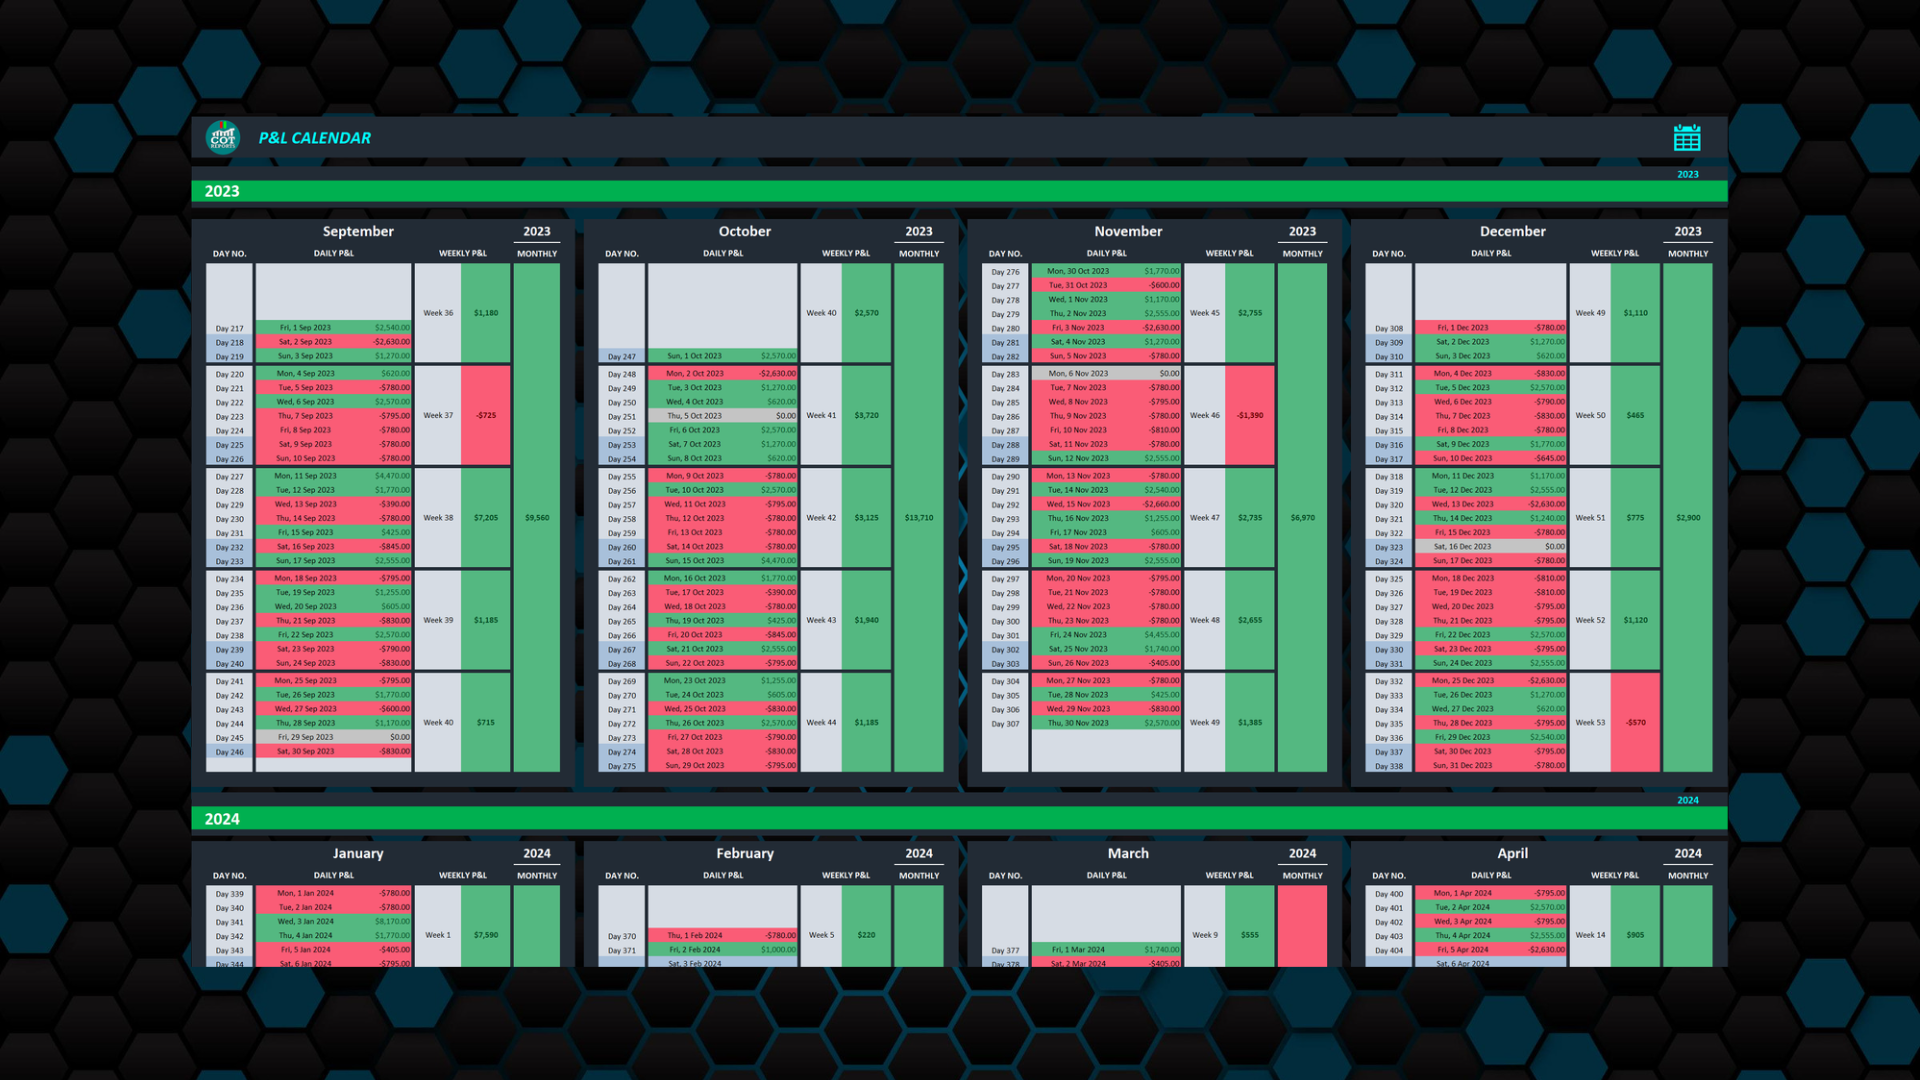
P&L Calendar Sheet
The perfect tool for keeping track of your past trading results.
Another benefit of the P&L Calendar format is that it allows you to see how you are performing during different periods of the year. This can be particularly useful for identifying seasonal patterns in the markets, and for adjusting your trading strategy accordingly. It’s the perfect tool for keeping track of your past trading results.
Customization Settings
A simple and effective way to track your trading performance is to use multiple criteria. The ‘Settings’ sheet in the trading journal spreadsheet allows you to customize your journal with customizable criteria, such as strategy name, session name, custom criteria (up to 10), and timeframes. Simply fill in the relevant criteria and analyze your performance based on what matters most to you.
- Set your account currency and starting balance
- Configure risk percentage and position sizing
- Add up to 10 custom trade categories
- Define your trading strategies and sessions
The Trading Journal – A Must Have Tool for Any Serious Trader
Overall, the Trading Journal Excel sheet is a powerful tool for any trader looking to improve their performance. This tool provides a detailed analysis of your trading history, allowing you to identify patterns and areas for improvement. With this information, you can make informed decisions based on your past performance. You can fine-tune your strategies and make better trades. The journal allows you to stay on top of your performance.
“Don’t let disorganization hold you back any longer. Take the first step towards better trading outcomes and increased profitability with the Trading Journal. Try it now and see the difference it can make in your trading!”
Please Read the Info Below
You only need to make a one-time payment; there are no hidden fees or subscriptions.
To use the Trading Journal Spreadsheet, ensure you have Microsoft Office 2016 or a newer version installed on your computer.
Have questions? We’re here to help. Contact us anytime!
If you don’t have Microsoft Office, download it (Office 2019) from the official website and purchase an affordable license key, usually around $7 from various online shops.
Start Tracking Your Trades Today
Join thousands of traders who have improved their performance with this powerful trading journal spreadsheet.