Comprehensive dashboard for effortless trade tracking and real-time results.
![TRADING JOURNAL [DEMO VERSION] - Image 2](https://cot-reports.com/wp-content/uploads/2023/05/TRADING-JOURNAL-SPREADSHEET-1.png)
![TRADING JOURNAL [DEMO VERSION] - Image 3](https://cot-reports.com/wp-content/uploads/2023/05/TRADING-JOURNAL-SPREADSHEET-2.png)
![TRADING JOURNAL [DEMO VERSION] - Image 4](https://cot-reports.com/wp-content/uploads/2023/05/TRADING-JOURNAL-SPREADSHEET-5.png)
![TRADING JOURNAL [DEMO VERSION] - Image 5](https://cot-reports.com/wp-content/uploads/2023/05/TRADING-JOURNAL-SPREADSHEET-8.png)
![TRADING JOURNAL [DEMO VERSION] - Image 6](https://cot-reports.com/wp-content/uploads/2023/05/TRADING-JOURNAL-SPREADSHEET-13.png)
![TRADING JOURNAL [DEMO VERSION] - Image 7](https://cot-reports.com/wp-content/uploads/2023/05/TRADING-JOURNAL-SPREADSHEET-16.png)
![TRADING JOURNAL [DEMO VERSION] - Image 8](https://cot-reports.com/wp-content/uploads/2023/05/TRADING-JOURNAL-SPREADSHEET-10.png)
![TRADING JOURNAL [DEMO VERSION] - Image 9](https://cot-reports.com/wp-content/uploads/2023/05/TRADING-JOURNAL-SPREADSHEET-9.png)
![TRADING JOURNAL [DEMO VERSION] - Image 10](https://cot-reports.com/wp-content/uploads/2023/05/TRADING-JOURNAL-SPREADSHEET-11.png)
![TRADING JOURNAL [DEMO VERSION] - Image 11](https://cot-reports.com/wp-content/uploads/2023/05/TRADING-JOURNAL-SPREADSHEET-3.png)
![TRADING JOURNAL [DEMO VERSION] - Image 12](https://cot-reports.com/wp-content/uploads/2023/05/TRADING-JOURNAL-SPREADSHEET-19.png)
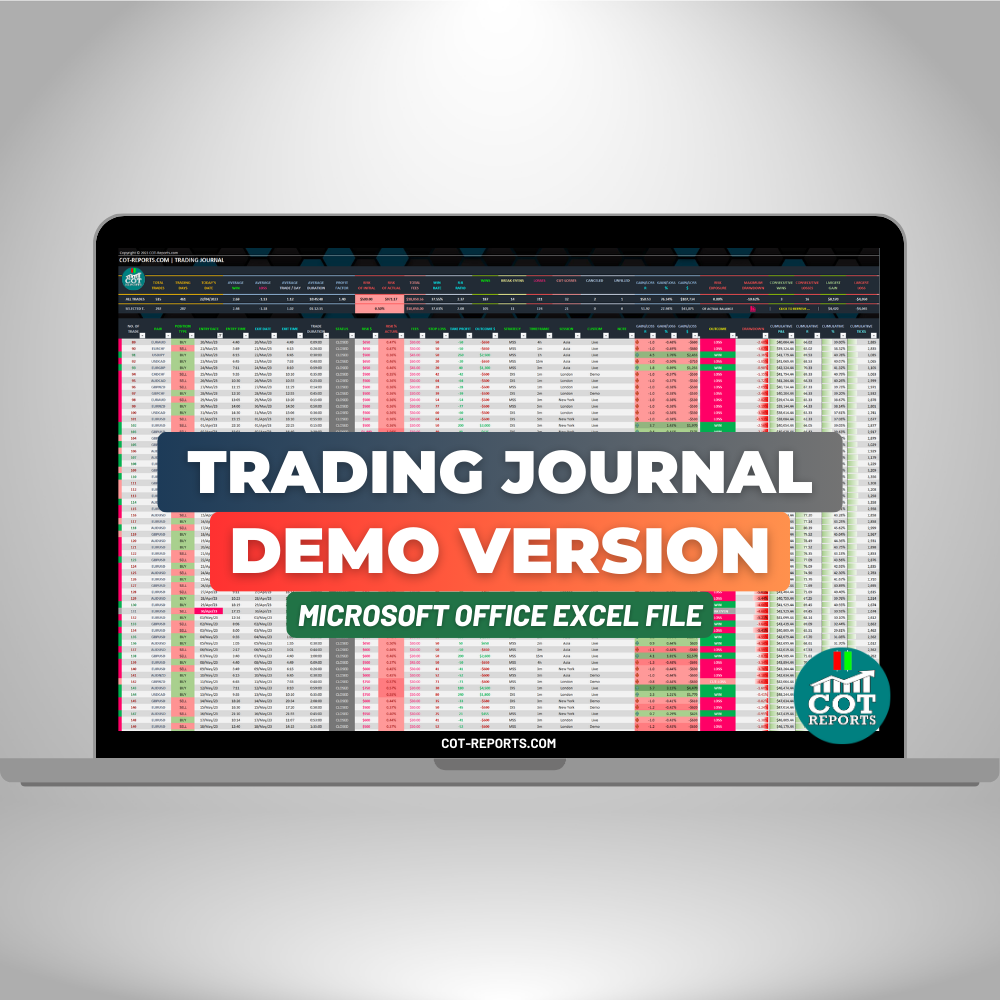
TRADING JOURNAL [DEMO VERSION]
$0,00
FREE
Demo Version
Try the Trading Journal before you buy. See all features in action!
Try the Demo Version and See How It Works
1
Trading Journal
2
Complete Statistics
Pivot tables with data on strategies, markets, position types, days and hours.
3
Dashboard
Hourly, daily, monthly performance, equity curve and historical drawdown charts.
4
P&L Calendar
Results filtered by years, months, days. Monitor your progress over time.
▶ Get Two Free PDFs: Setup instructions and features presentation included.
▶ Compatible: Microsoft Office 2016 and above required.
Description
Whether you’re a complete beginner or an advanced trader, the COT Reports Trading Journal is designed to help you take your trading to the next level!
COT Reports Trading Journal Spreadsheet
With just a few clicks, you can input all the relevant information about a trade, such as position type, risk percentage, risk type, strategy, timeframe and sessions.
The Trading Journal Spreadsheet automatically calculates important metrics for you, such as your profit or loss, return on investment, and much more. It’s simple, efficient, and accurate.
The File Consists of Four Powerful Sheets
✎ Trading Journal
Comprehensive dashboard at the top of the page for effortless trade tracking and real-time results.
☰ Complete Statistics
Pivot tables presenting data on strategies, markets, position types, days, hours, and outcomes.
▣ Dashboard
Hourly, daily, and monthly performance, equity curve, historical drawdown through visual charts.
📅 P&L Calendar
Results filtered by years, months, days. Monitor your progress over time conveniently.
Full Version Features
⚙ Assistant Feature
Step-by-step guidance for setting up, customizing, and filling in your first five trades.
⚡ User-Friendly Interface
Intuitive layout with strategic use of colors for immediate insights into outcomes.
⚠ Strong Risk Management
Alerts if risking too much, dynamically adjusts risk based on account balance.
☷ Performance Charts
Daily and hourly charts, Equity Curve and Account Drawdowns visualization.