
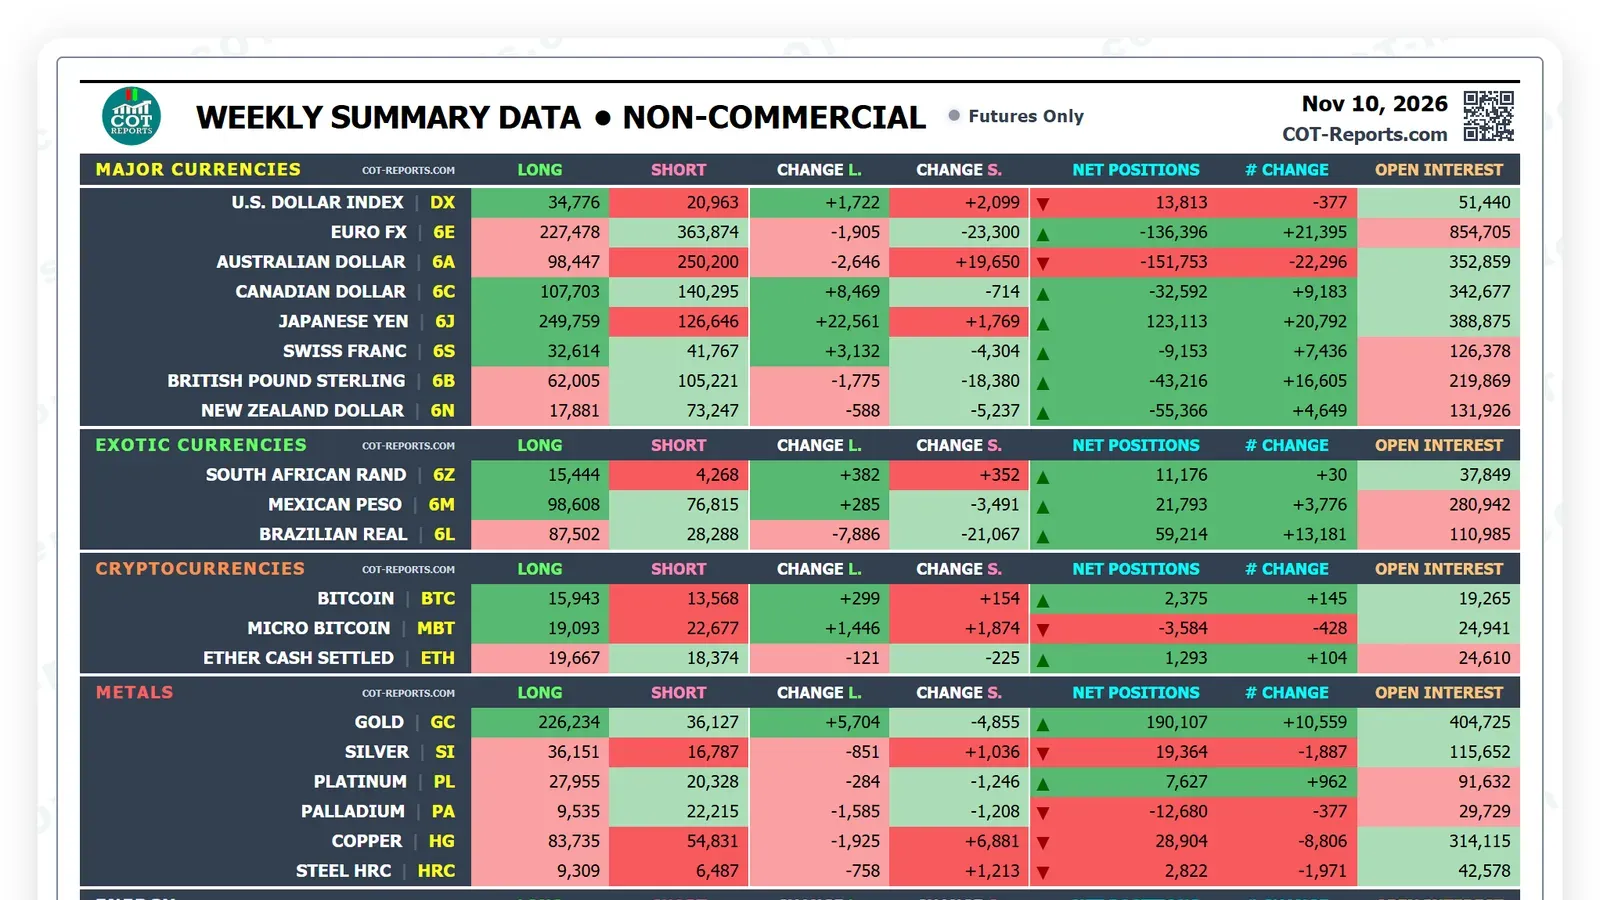
The CFTC (Commodity Futures Trading Commission) released its latest Commitments of Traders report on Monday, November 16, 2026, at 3:30 PM Eastern Time, with positions as of Tuesday, November 10. Veterans Day on Wednesday, November 11, moved the release from Friday. Every figure below is a fact from the CFTC file: who is net long, who is net short, and how it changed since the previous report.
COT report this week: the short answer
69 of 211 markets sit at a 3-year extreme as of November 10, 2026: 39 extremely high, 30 extremely low.Highest: Bitcoin, the Brazilian real, Nasdaq 100 Consolidated and the Treasury Bond, all at rank 100. Lowest: natural gas and Lean Hogs, both at rank 0.Largest weekly change among the 35 key markets: the VIX net short shrank by 30,759 contracts to 46,157.In 9 markets the speculators switched side, 5 of them natural gas markets.Next report: Friday, November 20, 2026, with positions as of Tuesday, November 17.
What does this week’s COT report show for the major markets?
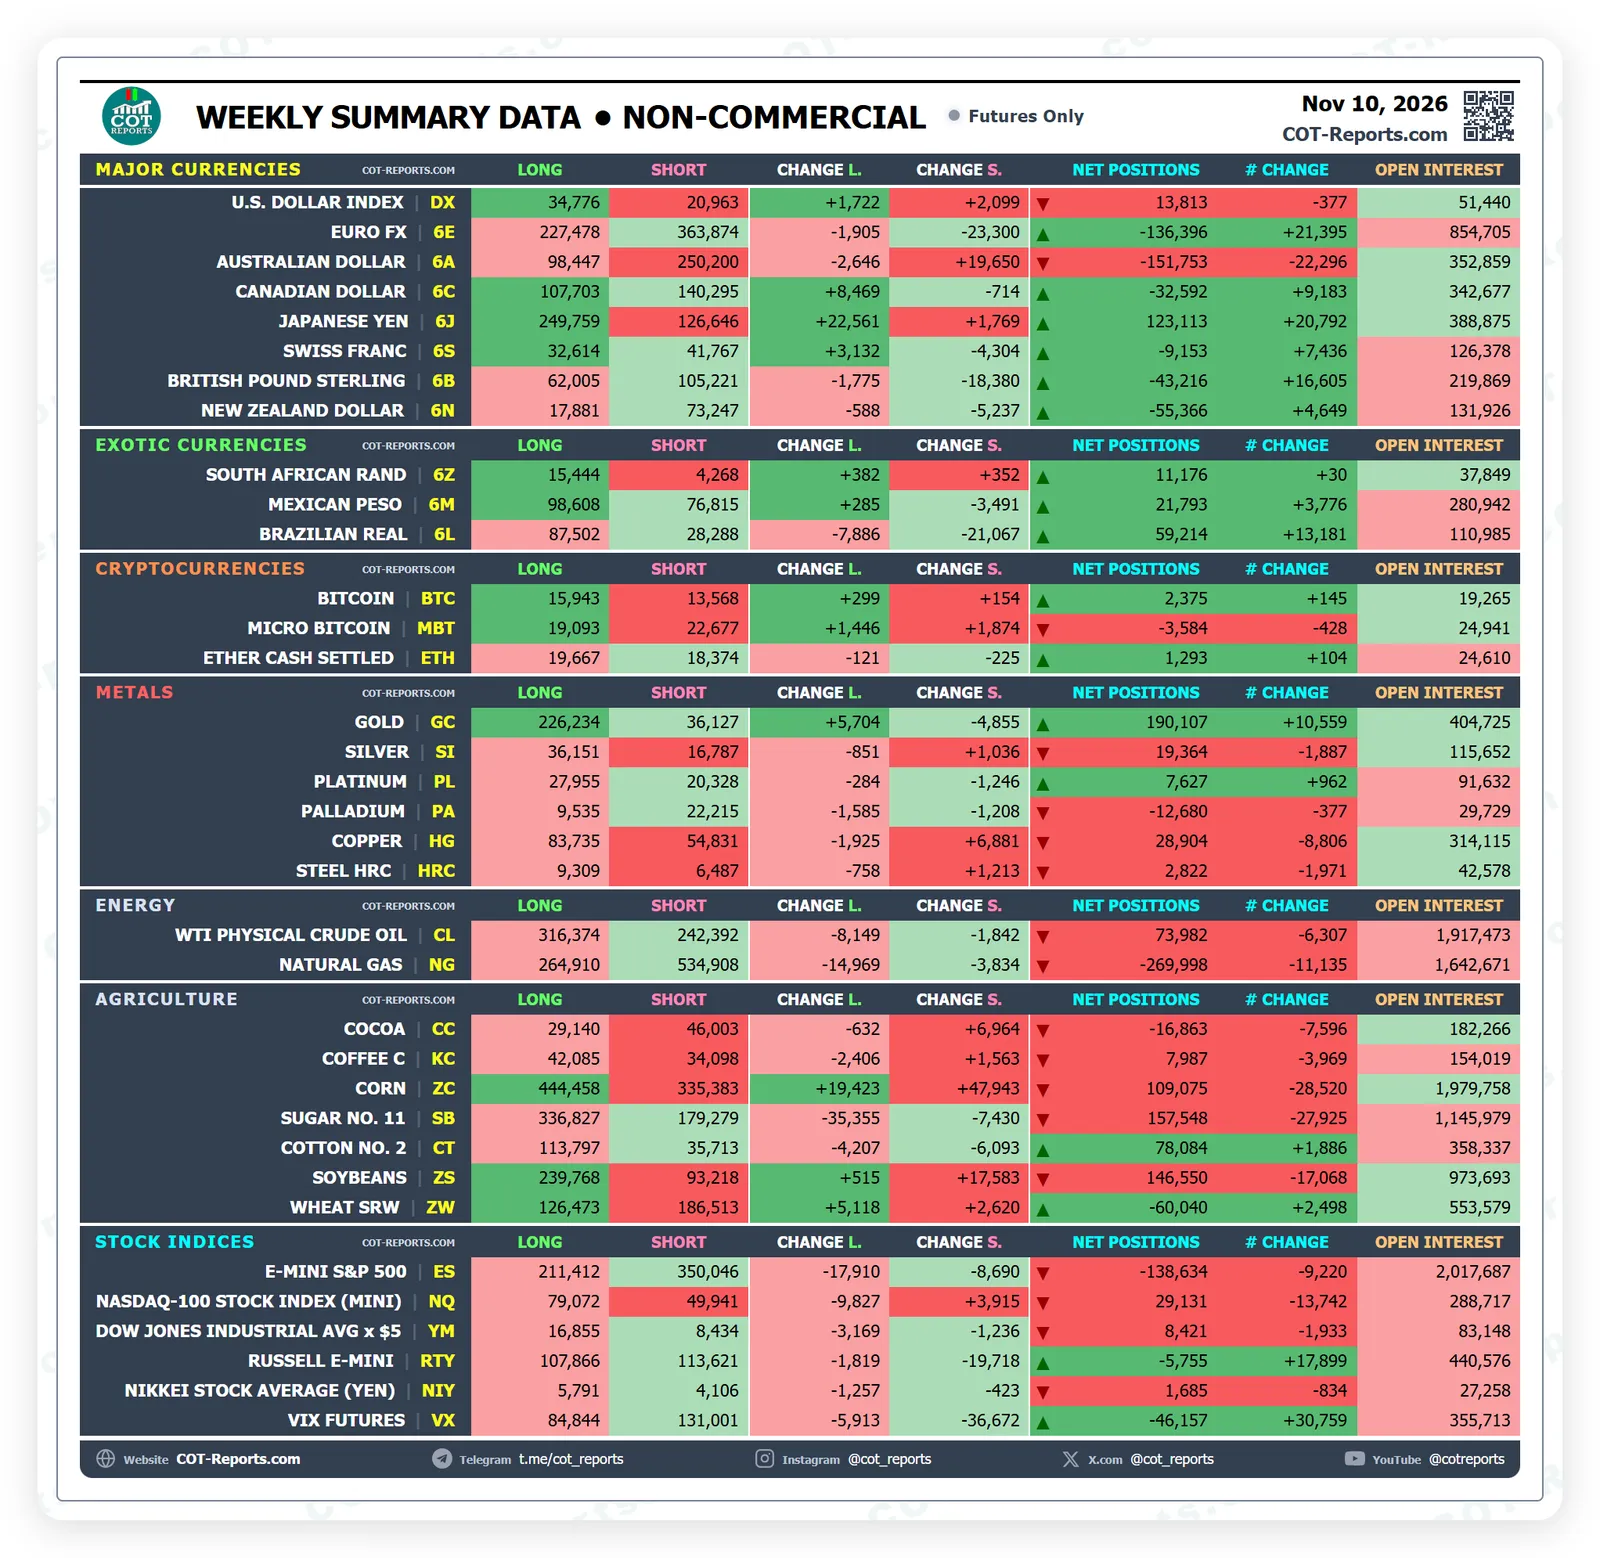
As of November 10, 2026, the Non-Commercial traders (large speculators) in the Legacy report are net long gold, WTI crude oil and the Japanese yen, and net short Euro FX, the E-mini S&P 500 and natural gas. Gold carries the largest net long of the six, 190,107 contracts. The Weekly Summary shows the same group (Futures Only) for 35 key markets:
| Market | Group (report) | Side | Net (contracts) | Weekly change |
|---|---|---|---|---|
| Gold | Non-Commercial (Legacy) | Net long | 190,107 | 10,559 more |
| Euro FX | Non-Commercial (Legacy) | Net short | 136,396 | 21,395 fewer |
| WTI crude oil | Non-Commercial (Legacy) | Net long | 73,982 | 6,307 fewer |
| E-mini S&P 500 | Non-Commercial (Legacy) | Net short | 138,634 | 9,220 more |
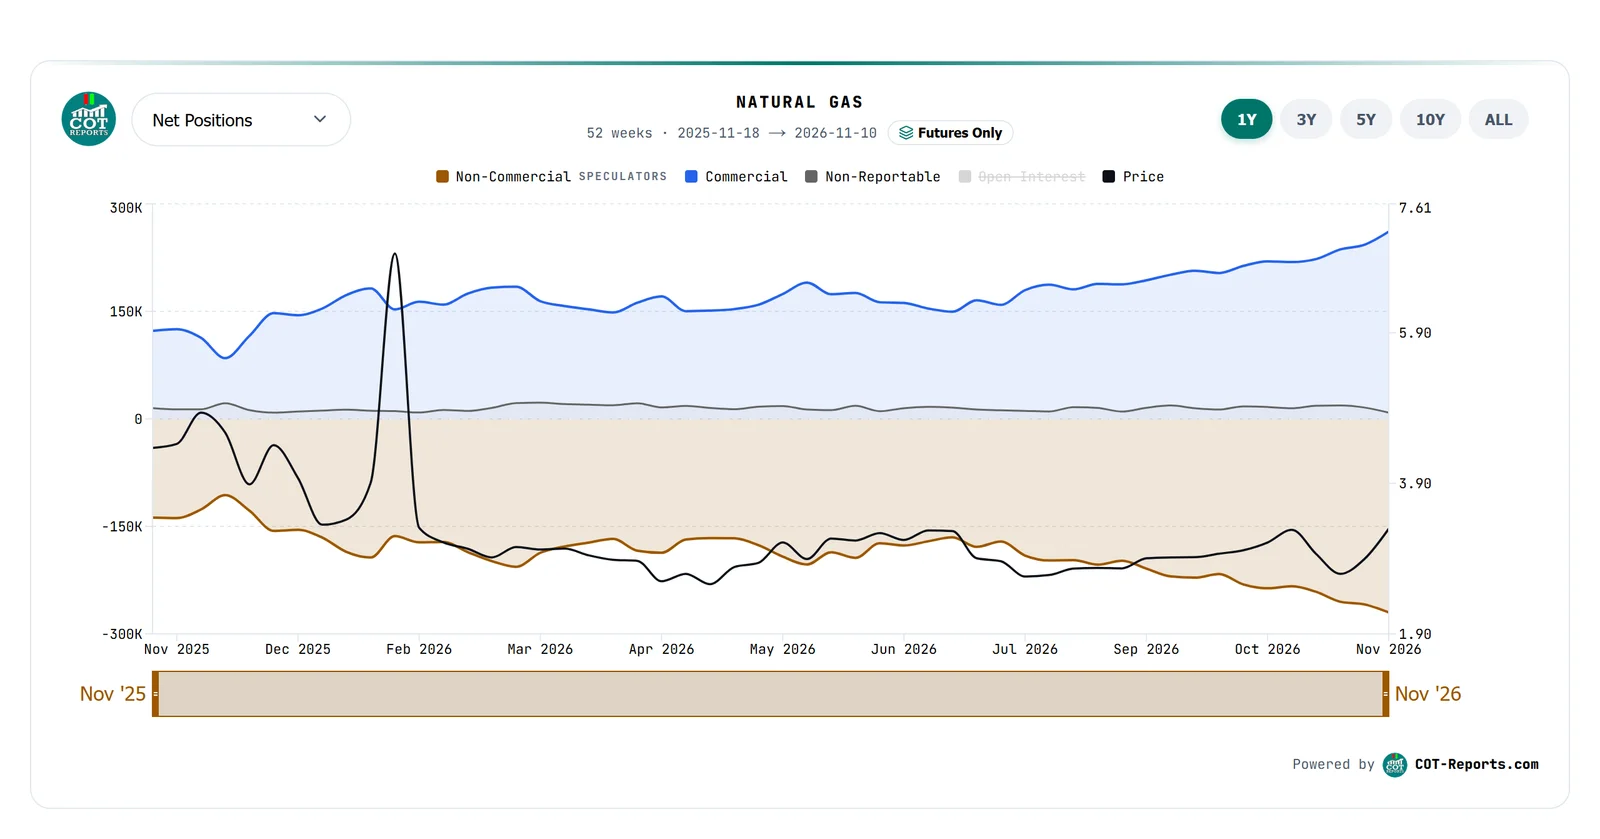
| Natural gas | Non-Commercial (Legacy) | Net short | 269,998 | 11,135 more |
| Japanese yen | Non-Commercial (Legacy) | Net long | 123,113 | 20,792 more |
The weekly change counts contracts of the net position: “more” means the net long or net short grew, “fewer” means it shrank.
Which markets are at a 3-year COT extreme this week?
Our COT Extremes page ranks the large speculators in 211 markets against their own last three years: Managed Money (large speculators) in the Disaggregated report, Leveraged Funds (large speculators) in the Traders in Financial Futures report. The 3-year rank places their net position, as a share of open interest, between its lowest level of the last three years (0) and its highest (100). This week 69 markets sit at a 3-year extreme: 39 extremely high (rank 90 or more) and 30 extremely low (rank 10 or less).
Four markets are at rank 100, all Leveraged Funds: Bitcoin (net short, 9 weeks in the band), the Brazilian real (net long, 2 weeks), Nasdaq 100 Consolidated (net long, 4 weeks) and the Treasury Bond (net short, 12 weeks or more). A rank of 100 with a net short position means the net short is the smallest it has been in three years, relative to open interest. At rank 0 sit natural gas (Managed Money, net short, 7 weeks in the band) and Lean Hogs (Managed Money, net short, 12 weeks or more). Coffee, Euro FX and Lumber follow at rank 1.
Gold, Euro FX, crude oil, S&P 500: where do speculators stand?
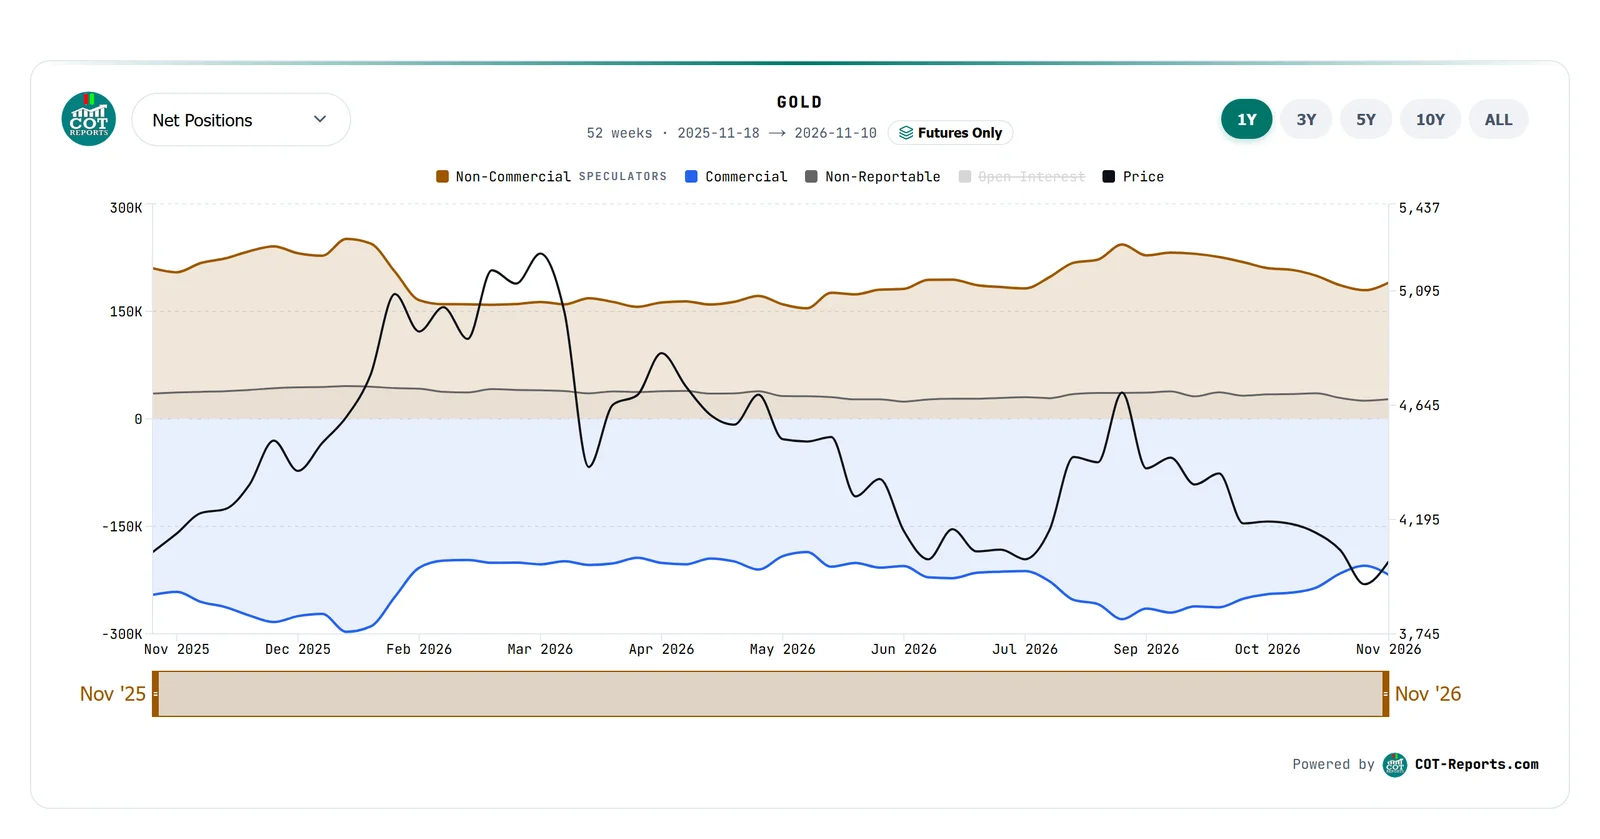
Gold COT Report: the Non-Commercial traders are net long 190,107 contracts, 10,559 more than a week earlier. Their longs rose by 5,704 to 226,234 and their shorts fell by 4,855 to 36,127, in an open interest of 404,725 contracts (up 5,556). In the Disaggregated report, Managed Money is net long with a 3-year rank of 43, up 11 points.
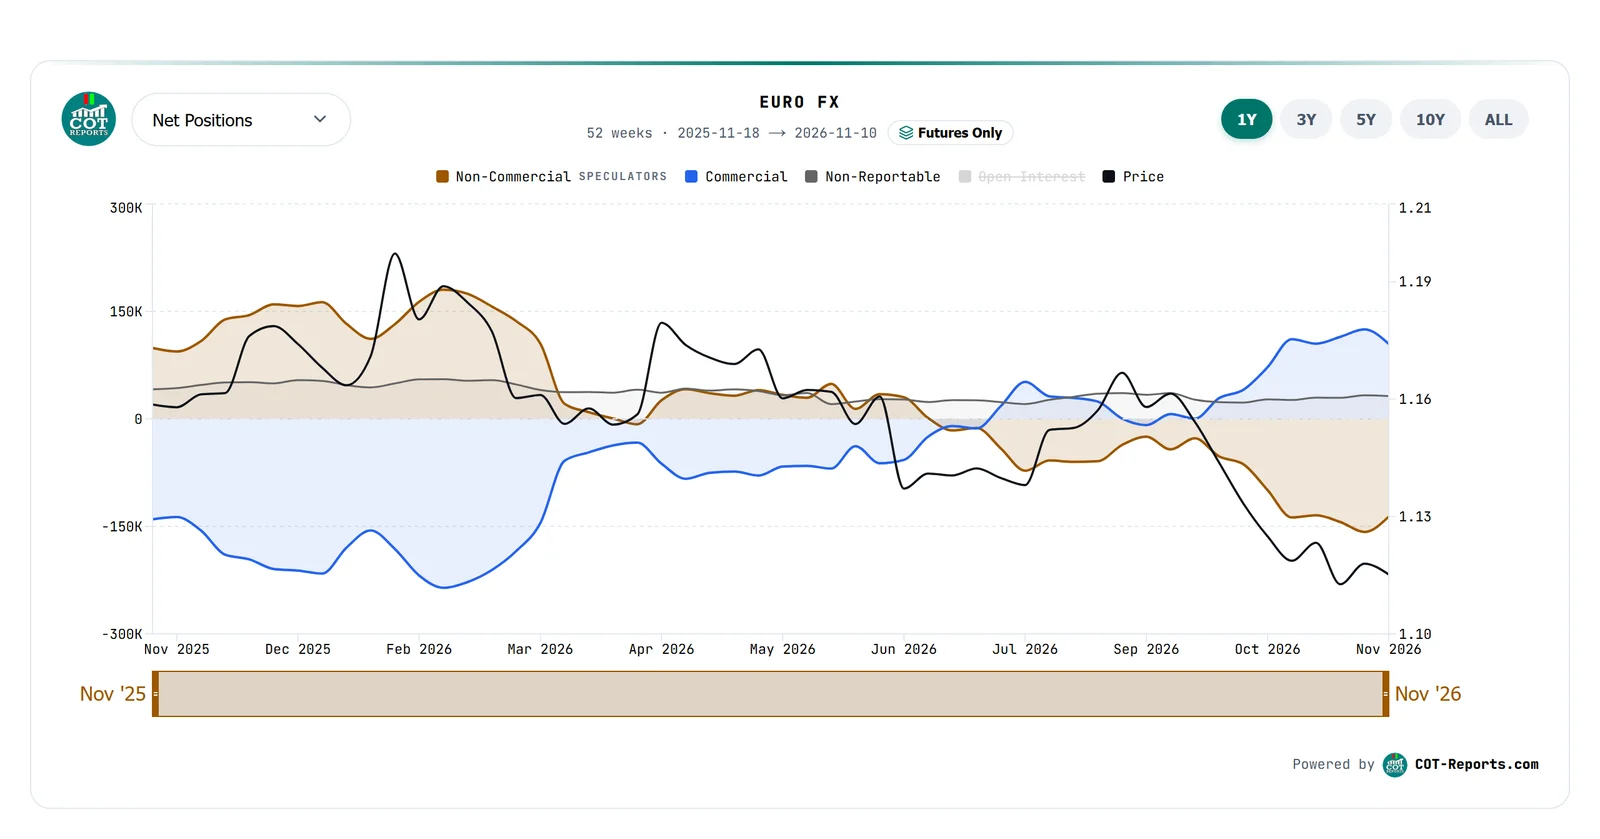
Euro FX COT Report: the Non-Commercial net short shrank by 21,395 contracts to 136,396, with 227,478 longs against 363,874 shorts in an open interest of 854,705. In the Traders in Financial Futures report, Leveraged Funds are net short at rank 1, 5 weeks in the extremely low band.
Crude Oil COT Report: in WTI crude oil the Non-Commercial net long fell by 6,307 contracts to 73,982, with 316,374 longs against 242,392 shorts in an open interest of 1,917,473. In the Disaggregated report, Managed Money is net long with a 3-year rank of 12.
S&P 500 COT Report: in the E-mini S&P 500 the Non-Commercial net short grew by 9,220 contracts to 138,634. In the Traders in Financial Futures report, the Leveraged Funds’ rank rose 32 points to 64, still net short.
In the Japanese yen the Non-Commercial net long grew by 20,792 contracts to 123,113, while Leveraged Funds are net short at rank 77. In silver the Non-Commercial net long fell by 1,887 to 19,364; Managed Money is net long at rank 4, 5 weeks in the extremely low band.
Where did COT positions change the most this week?
Among the 35 key markets of the Weekly Summary, the largest weekly change came in the VIX, where the Non-Commercial net short shrank by 30,759 contracts to 46,157. In corn the net long fell by 28,520 to 109,075, with 444,458 longs against 335,383 shorts in an open interest of 1,979,758. In Sugar No. 11 the net long fell by 27,925 to 157,548, and in soybeans by 17,068 to 146,550.
In currencies, the Australian dollar net short grew by 22,296 contracts to 151,753, while the British pound net short shrank by 16,605 to 43,216 and the Canadian dollar net short by 9,183 to 32,592. The Brazilian real net long grew by 13,181 to 59,214. In the Russell 2000 the net short shrank by 17,899 to 5,755.
On the 3-year rank, the largest moves of the week came in MSCI EAFE, where the Leveraged Funds’ rank rose 66 points to 86, and in Nano Ether, where it fell 58 points to 10.
Where did speculators switch between net long and net short?
In 9 markets the speculators’ net position changed sign. In MSCI EAFE, Leveraged Funds turned net long, with the largest rank move of the week (up 66 points to 86). In the E-mini S&P Energy Sector they turned net short (rank 57). In the Disaggregated report, Managed Money turned net short in corn (rank 57) and net long in platinum (rank 20). The other 5 switches are natural gas markets, below.
Natural gas: Managed Money at rank 0, basis markets switch side
Natural Gas COT Report: in the Disaggregated report, Managed Money ranks 0 in natural gas, net short, 7 weeks in the extremely low band. In the Legacy report the Non-Commercial net short grew by 11,135 contracts to 269,998, the largest net short among the 35 key markets, with 264,910 longs against 534,908 shorts in an open interest of 1,642,671.
In four related gas markets, Managed Money turned net long this week: Henry Hub Basis (rank 80, up 42 points), Chicago Citygate Index (rank 94, up 39), PG&E Citygate Basis (rank 38, up 21) and Chicago Basis (rank 64, up 13). In Natural Gas Last Day (ICE LD1), Managed Money turned net short, at rank 2.
How to check these COT numbers yourself
Three numbers carry this post. The net position is longs minus shorts. The weekly change is how much it moved since the previous report. The 3-year rank places the net position, as a share of open interest, inside its own range of the last three years.
Everything above comes from pages anyone can open. The Latest COT Report lists every market of this release, the Simplified table shows each market week by week, and the COT Charts draw the net positions over time, all markets, all periods. A free account opens up to 10 years of history on the tables.
COT Premium adds the Disaggregated and Traders in Financial Futures report families in full, the 3-year rank of every trader group on the heatmap, and CSV export.
This post describes positions reported to the CFTC. It is not investment advice and makes no statement about future prices.
Sources
- CFTC: Commitments of Traders reports (opens in a new tab)
- COT-Reports.com: COT Extremes (counts, 3-year ranks, side switches) (opens in a new tab)
- COT-Reports.com: COT Weekly Summary (Legacy, 35 key markets) (opens in a new tab)
- COT-Reports.com: gold COT data, 3 months (longs, shorts, open interest) (opens in a new tab)
- COT-Reports.com: CFTC release schedule (opens in a new tab)
Figures read on November 16, 2026 from the live pages above, which are built from the CFTC’s published files. The 3-year rank: the net position as a share of open interest, placed in its own range of the last three years.