


COT Charts
Net positioning over time · Free, every market · Updated every Friday
Interactive net-position charts for every tracked CFTC futures market. Watch positioning unfold week by week, brush to a custom range, or share a chart link. Open by design — every market, every period, every group available without an account.
Currently showing: GOLD (GC) · Variant: Futures Only
About COT Charts
COT-Reports Charts plot CFTC Non-Commercial, Commercial and Non-Reportable net positions and open interest as a historical time series alongside the underlying market price — designed to visually identify positioning extremes, divergences and momentum shifts going back to 1986 for the Legacy Futures Only format.
- Source: U.S. Commodity Futures Trading Commission (CFTC)
- Price data: Yahoo Finance
- Release schedule: Every Friday, 3:30 PM ET (delayed on US federal holidays)
- Markets covered: All 380 CFTC futures markets (Legacy Futures Only)
- Trader categories: Non-Commercial, Commercial, Non-Reportable, Open Interest, Price
Frequently Asked Questions
What do the COT charts show?
The COT charts plot weekly Non-Commercial, Commercial and Non-Reportable net positions over time, with optional overlays for open interest and the underlying market price (settled weekly). Visual time-series make it easier to spot positioning extremes, divergences and rotations than reading raw numbers in a table.
How far back do the COT charts go?
Legacy Futures Only data goes back to 1986. Disaggregated and Traders in Financial Futures (TFF) data go back to June 2006, and Supplemental Index Traders data to January 2006 — the CFTC backfilled these histories before the reports were formally introduced (2009–2010). The chart period selector covers year-to-date, 3 and 6 months and 1, 2, 3, 5 or 10 years; Premium custom date ranges reach back to the start of each history.
Why is the price overlay weekly instead of daily?
COT data is published weekly with positions captured as of Tuesday's close. To match, the price overlay uses the closing price of that same Tuesday (the report date) from Yahoo Finance for the front-month contract (or a continuous mapped contract), or of the nearest trading day when that Tuesday was a holiday. Daily price would create alignment artifacts since positioning data has no intraday granularity.
Are the COT Charts free?
Yes — Charts are fully open. Every CFTC market and every time period is accessible to all visitors with no signup or login. The chart engine is the only surface on the site that bypasses the historical-period gate that applies to other report formats.
How do I spot a positioning extreme on the chart?
Look at where the Non-Commercial net position sits relative to its multi-year range. When the green line touches the upper end of its historical channel, large speculators are crowded long — a level that has historically often come before reversals. When it touches the lower end, they are crowded short. Crossings of the zero line often coincide with trend changes.
Explore All Report Formats
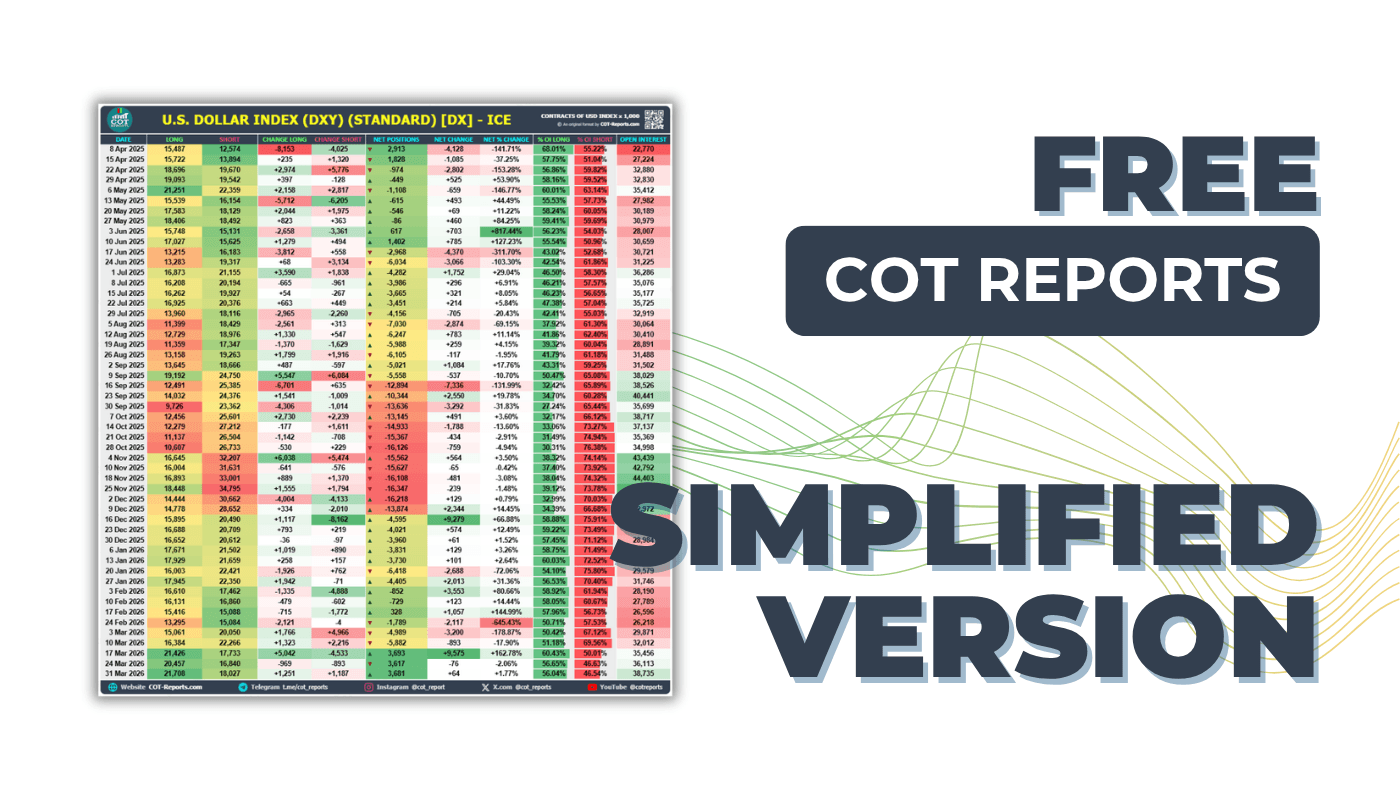
Simplified
Weekly data per market (6 months without an account, up to 10 years with a free one) with Non-Commercial, Commercial, and Non-Reportable positions.
View Simplified COT Report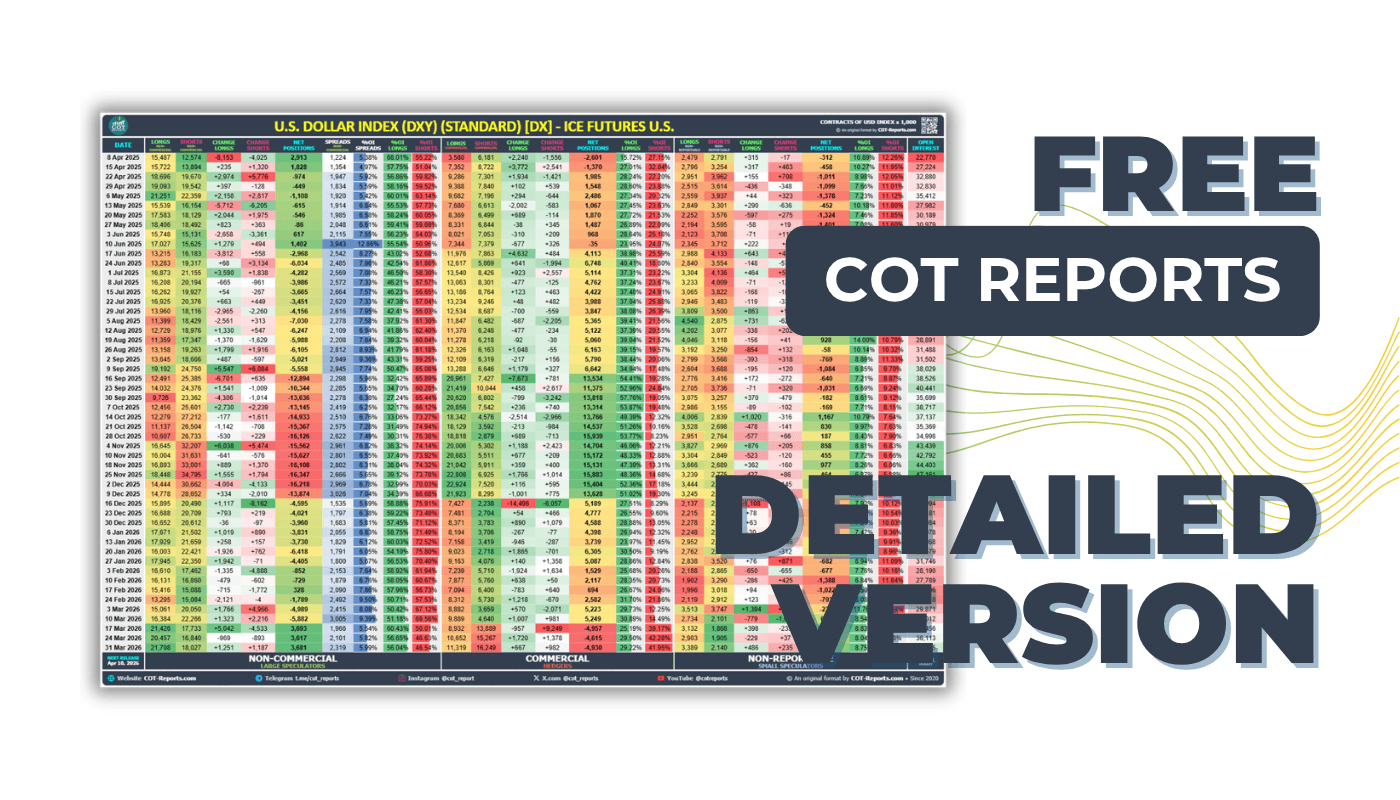
Detailed
Complete breakdown with Non-Commercial, Commercial, and Non-Reportable trader positions and changes.
View Detailed COT Report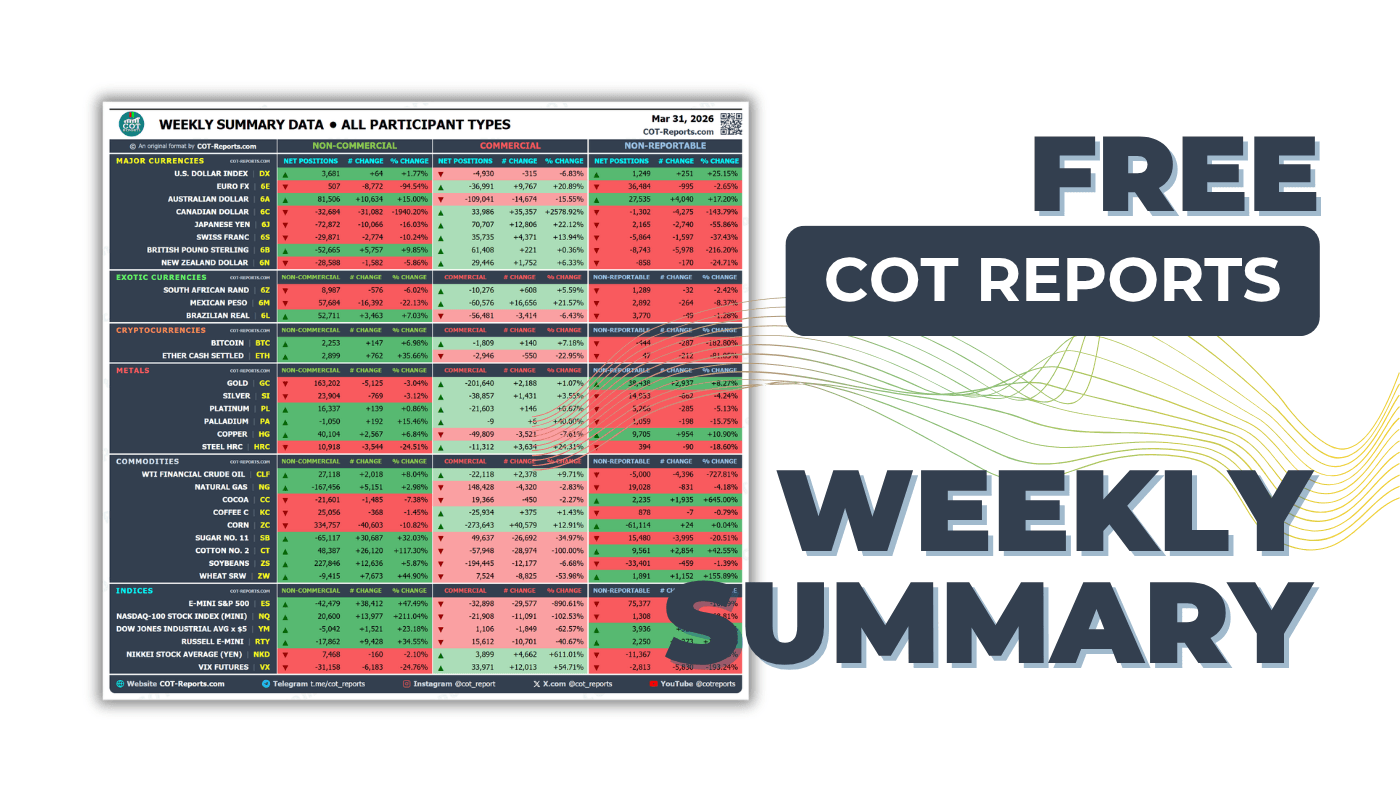
Weekly Summary
All positions at a glance. NET POSITIONS, % changes, and net/OI for all markets.
View Weekly Summary COT Report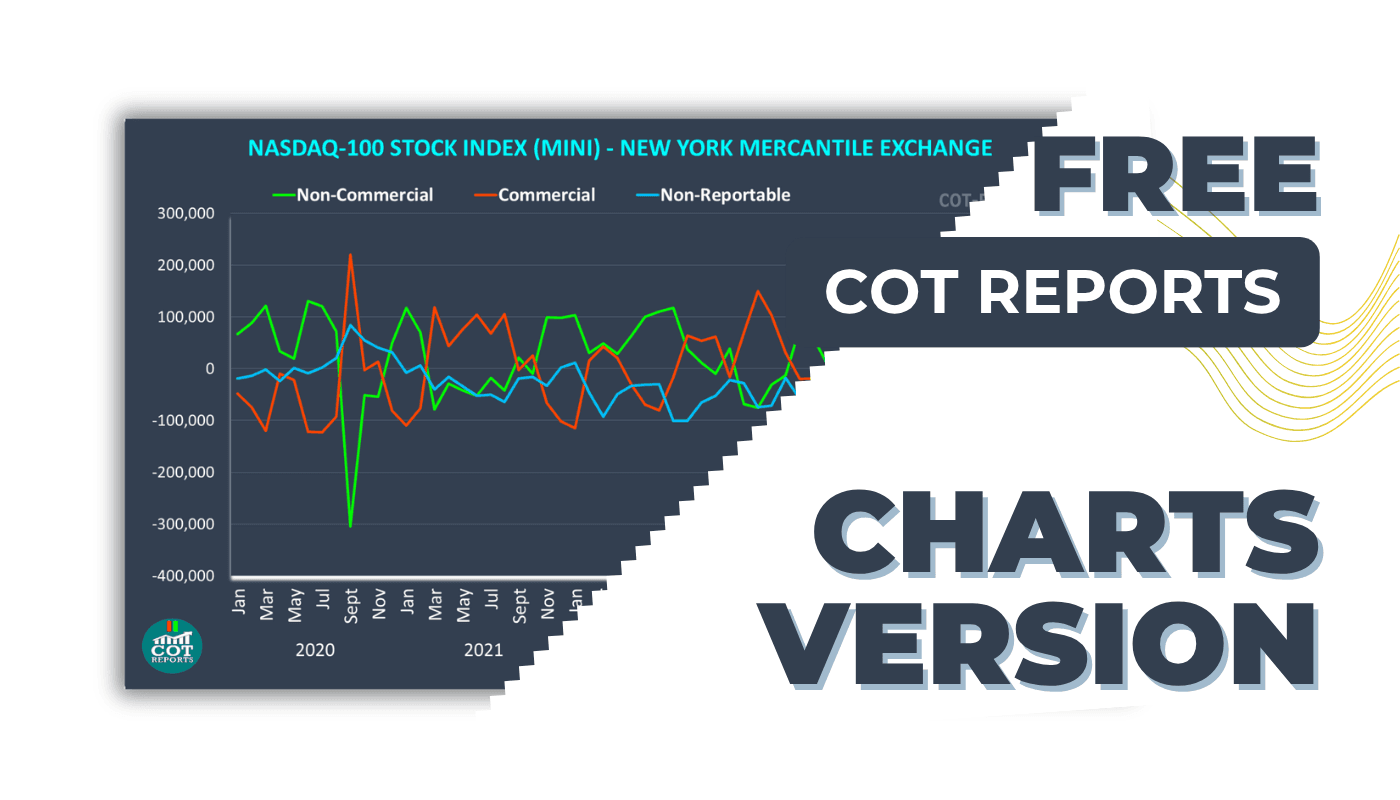
Charts
Visual COT data: Net positions over time, Long vs Short bars, and trend analysis.
View Charts COT ReportUnlock Every COT Report Format.
Every COT Report with Advanced Analytics
Go beyond the free Legacy reports: the Disaggregated, TFF and Supplemental formats, custom date ranges back to 1986, the Positioning Heatmap, Advanced Charts and CSV export.
REPORTS & HISTORY
- ✓Disaggregated — Managed Money & Swap Dealers
- ✓Traders in Financial Futures (TFF) — Leveraged Funds & Asset Managers
- ✓Supplemental — Commodity Index Traders
- ✓Simplified, Detailed & Latest views of all three
- ✓Custom date ranges, back to 1986
- ✓Both CFTC variants of every report, one click apart
DATA & TOOLS
- ✓Close Price column & CSV export
- ✓Every trader group's figures on the Positioning Heatmap
- ✓Advanced Charts & COT Volume Profile
- ✓Custom Weekly Summary & My Markets
- ✓Table screenshots (PNG) with no daily limit
- ✓The complete How to Read the Simplified COT Report guide (3-month and annual plans)
The 3-month and 1-year plans include the How to Read the Simplified COT Report guide free.


 Any Prop Firm.
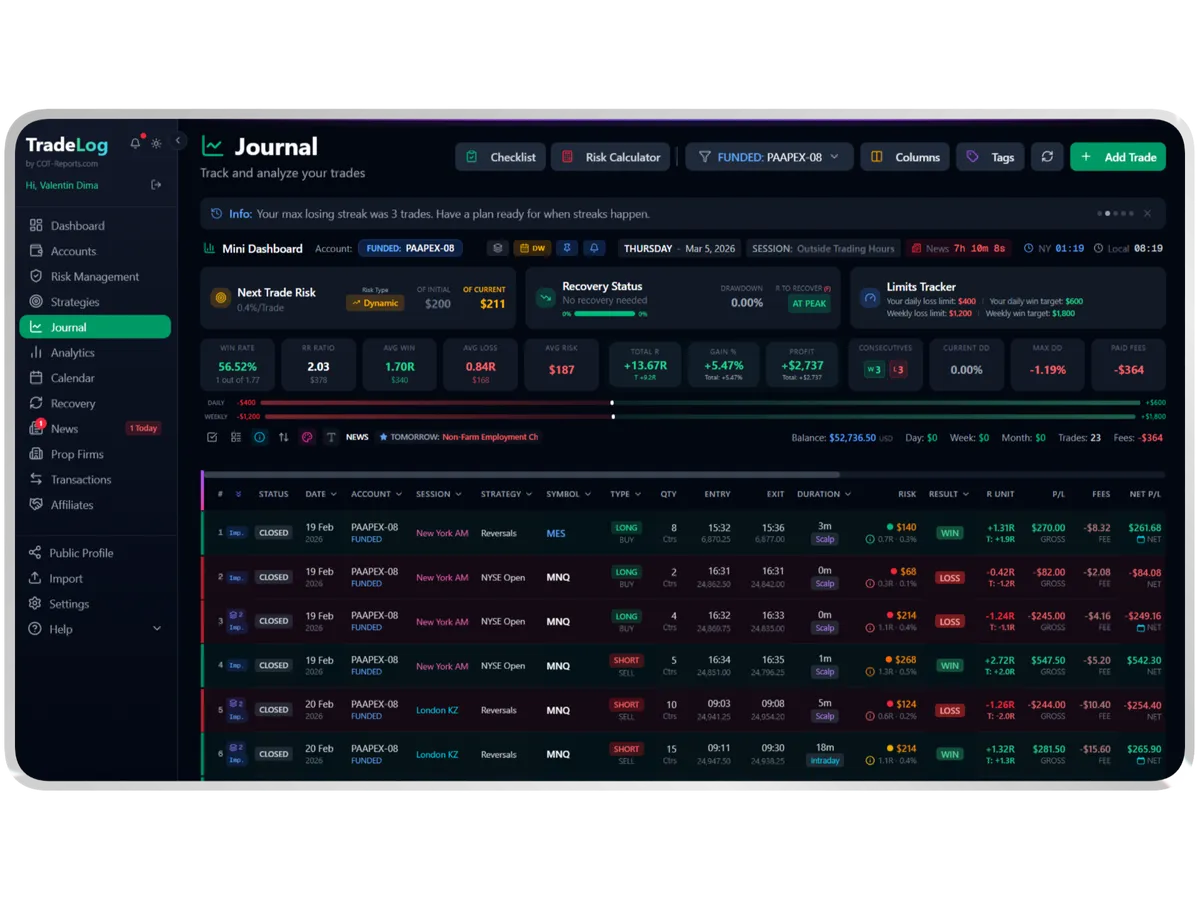
Automated Trading Journal
Auto-sync trades from MetaTrader, NinjaTrader, cTrader, Tradovate and more. Built-in analytics, prop-firm tracking, risk management and multi-account support. Basic and Premium include free EAs, a free cBot and a free NT Add-On.










COT-Reports Marketplace
Traders build it. Traders use it.
Probably the best trading tools, made by traders for the COT-Reports community. Buy what you need, or list what you built.
 COT-Reports.com
Every Friday, 35 markets land in Telegram. FREE.
The COT Report Simplified for each market in the map, plus the Weekly Summary, minutes after the CFTC publishes. Between Fridays, the bot sends any of them on request and keeps a free trading journal.