COT-Reports
COT-Reports.com
COT-Reports
COT-Reports
FREE · 0–100 PERCENTILE · 4 LOOKBACKS

COT Index

0–100 percentile rank · Multi-window · Updated every Friday

The COT Index normalizes net positioning into a 0–100 score — 0 = most short ever, 100 = most long ever, over 26-week, 52-week, 156-week or 260-week lookbacks. Read at a glance whether a category is at a positioning extreme without manually comparing this week's number to the trailing range.

The COT Index is a 0-100 oscillator built from the weekly CFTC Commitments of Traders report. It rescales the net position of a trader category onto a fixed scale using the highest and lowest readings over a chosen lookback window — so 100 is the most long that group has been, and 0 is the most short. Above 80 is conventionally read as an extreme long, below 20 as an extreme short.

  • Source: U.S. Commodity Futures Trading Commission (CFTC)
  • Release schedule: Every Friday, 3:30 PM ET (delayed on US federal holidays)
  • Formula: 100 × (Net − Min) / (Max − Min) over N weeks
  • Lookback windows: 26W · 52W · 156W (3Y) · 260W (5Y)
Configure your COT Report analysis parameters below
Popular:
Managed Money positioning lives in the Disaggregated and TFF reports — see Advanced Charts (Premium). This page covers the universal Legacy taxonomy that exists for every CFTC market.
Loading...
Share:

About the COT Index

The COT Index normalizes weekly Commitments of Traders net positions into a 0-100 percentile rank across the selected lookback window. A reading near 100 means the trader category is at its most net-long extreme of the period; near 0 means the most net-short extreme. Data is sourced directly from the U.S. Commodity Futures Trading Commission (CFTC) and updated weekly on Friday at 3:30 PM ET. Use the lookback pills to compare short-term sentiment (26w / 52w) against multi-year context (156w / 260w).Currently showingEURO FX6E52WNon-Commercial2026-09-22
Embed this chartGet iframe snippet

Get iframe snippet

What is the COT Index?

The COT Index normalizes the net position of a trader category to a 0-100 scale, where 0 means the most short the group has been over the chosen lookback and 100 means the most long. It collapses 'how extreme is positioning right now?' into a single number you can read at a glance.

Definition

The COT Index, sometimes called the Briese Index after analyst Steve Briese who popularized it, takes the net position (long minus short contracts) of a trader category in the weekly CFTC report and rescales it onto a 0-100 axis using the highest and lowest readings of the chosen lookback window. A 100 means the group is at its most long over that window; a 0 means its most short. Anywhere between is read as a percentile of historical conviction.

The Formula

The math is a min–max normalization. For each weekly observation, you measure how far the current net is from the minimum net of the last N weeks, then divide by the full range. Multiplied by 100, you get a value bounded by 0 and 100 inclusive. Window N is the only knob — different lookbacks answer different questions about whether today's positioning is unusual.

COT Index = 100 × (Current Net − Min Net over N) / (Max Net over N − Min Net over N)

where  Net = Long − Short  for the selected trader category
       N   ∈ { 26, 52, 156, 260 }  weeks

How to read the COT Index

The two regions that matter are the tails. Readings above 80 are typically called extreme long — the trader group is more long than they've been almost any week of the lookback. Below 20 is extreme short. Many strategies built on the COT Index treat these tails as fade signals when commercials are extreme (commercials are hedgers — they sell into strength and buy into weakness, so their extremes often precede reversals), and as crowded-trade warnings when speculators (Non-Commercial) are extreme in the same direction as price. The middle band (20-80) is normal positioning. Many traders also watch divergences: price making a new high while the COT Index for Non-Commercial commits a lower high is a classic exhaustion read.

Example interpretations

Suppose Gold's commercial COT Index over a 52-week lookback hits 95 — commercials have built one of their most-long positions of the past year. In COT folklore, that's a bullish setup, because commercials usually accumulate near bottoms. Conversely, if the Non-Commercial COT Index for Gold also hits 95 (large speculators piling in long while commercials sell), the trade is crowded and at risk of mean reversion. The split between commercial and speculator extremes is what gives the index its edge — it's not just 'who's long,' it's 'who's at an extreme relative to their own recent history.'

Limitations

The COT Index is descriptive, not predictive. An extreme can persist for months — markets can stay irrational longer than positions can pivot. The index also depends entirely on the chosen lookback: a 26-week extreme says nothing about a 156-week regime, so cross-checking multiple windows is good hygiene. Finally, the weekly publication lag (Tuesday positions, Friday release) means signals are always slightly stale. Use the COT Index for context, not as a standalone trading rule.
Frequently Asked Questions

What is the COT Index?

The COT Index is a 0-to-100 oscillator that normalizes the net position of a CFTC trader category across a chosen lookback window. 100 means the most long that group has been across the window; 0 means the most short. It standardizes positioning so different markets and time periods become directly comparable.

How is the COT Index calculated?

Index = 100 × (Current Net − Min Net) / (Max Net − Min Net), measured over the last N weeks. Net = Long − Short for the chosen trader category (Non-Commercial, Commercial, or Non-Reportable). Lookback windows on this page are 26, 52, 156, and 260 weeks.

What lookback window should I use?

26 weeks captures recent positioning pressure — good for tactical timing. 52 weeks is the industry-standard one-year cycle view. 156 weeks (3 years) shows multi-year regimes. 260 weeks (5 years) reveals secular extremes. Many traders look for confluence — when multiple windows agree on an extreme, the signal is strongest.

What does an extreme reading mean?

Above 80 is extreme long, below 20 is extreme short. For commercials (hedgers), extremes are typically faded — they accumulate against the prevailing trend. For Non-Commercial (large speculators), extremes signal a crowded trade — the move often continues short term but is at heightened risk of mean reversion.

How is the COT Index different from the COT Heatmap?

The COT Index is one number per market, for one trader category, at one lookback. The COT Heatmap shows the percentile rank of every market across every category in a single grid view — a screening tool. The COT Index is for deep dives on a single market; the Heatmap is for cross-market scanning. Both use percentile-style normalization.

Explore all report formats

Simplified COT Report preview

Simplified

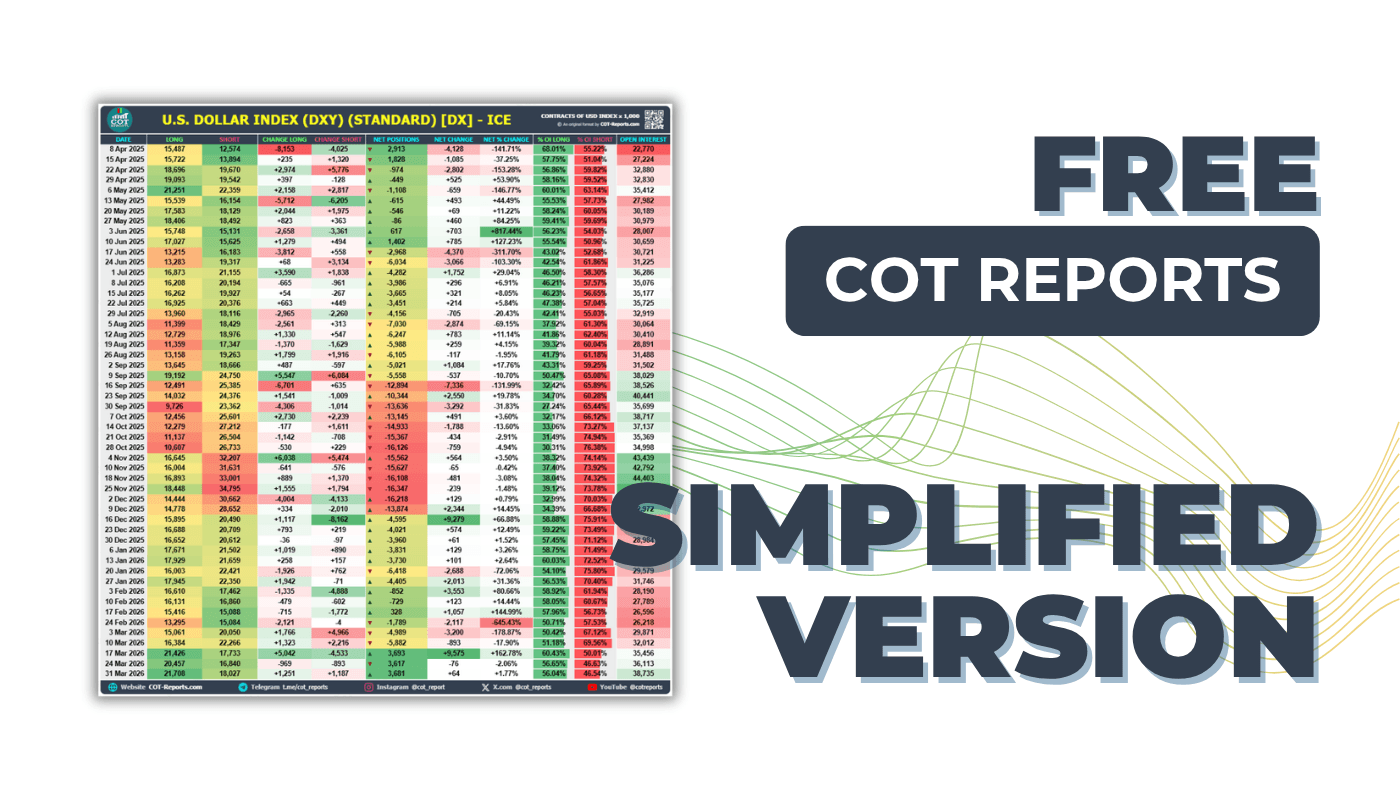
Up to 10 years of weekly data per market with Non-Commercial, Commercial, and Non-Reportable positions.

View Simplified COT Report
Detailed COT Report preview

Detailed

Complete breakdown with Non-Commercial, Commercial, and Non-Reportable trader positions and changes.

View Detailed COT Report
Weekly Summary COT Report preview

Weekly Summary

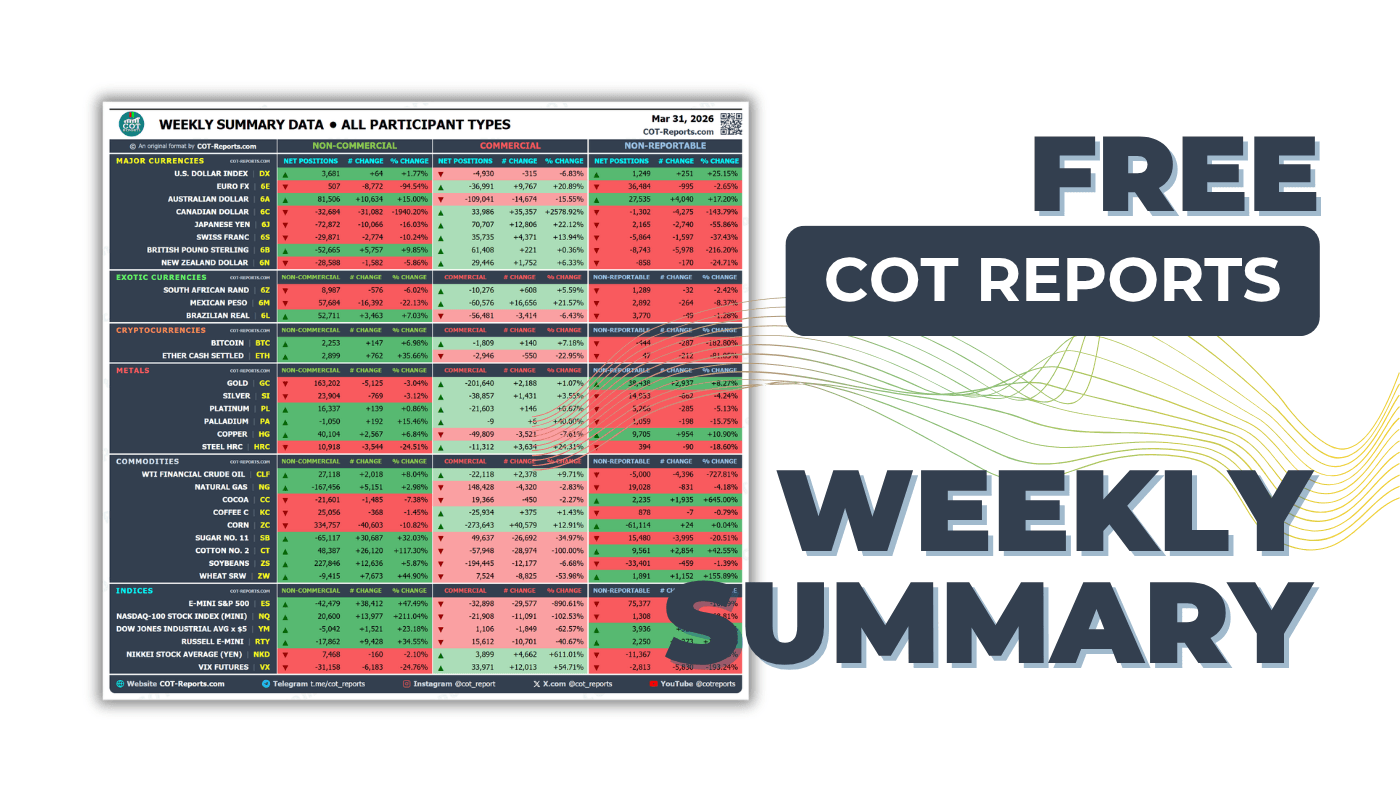
All positions at a glance. NET POSITIONS, % changes, and net/OI for all markets.

View Weekly Summary COT Report
Charts COT Report preview

Charts

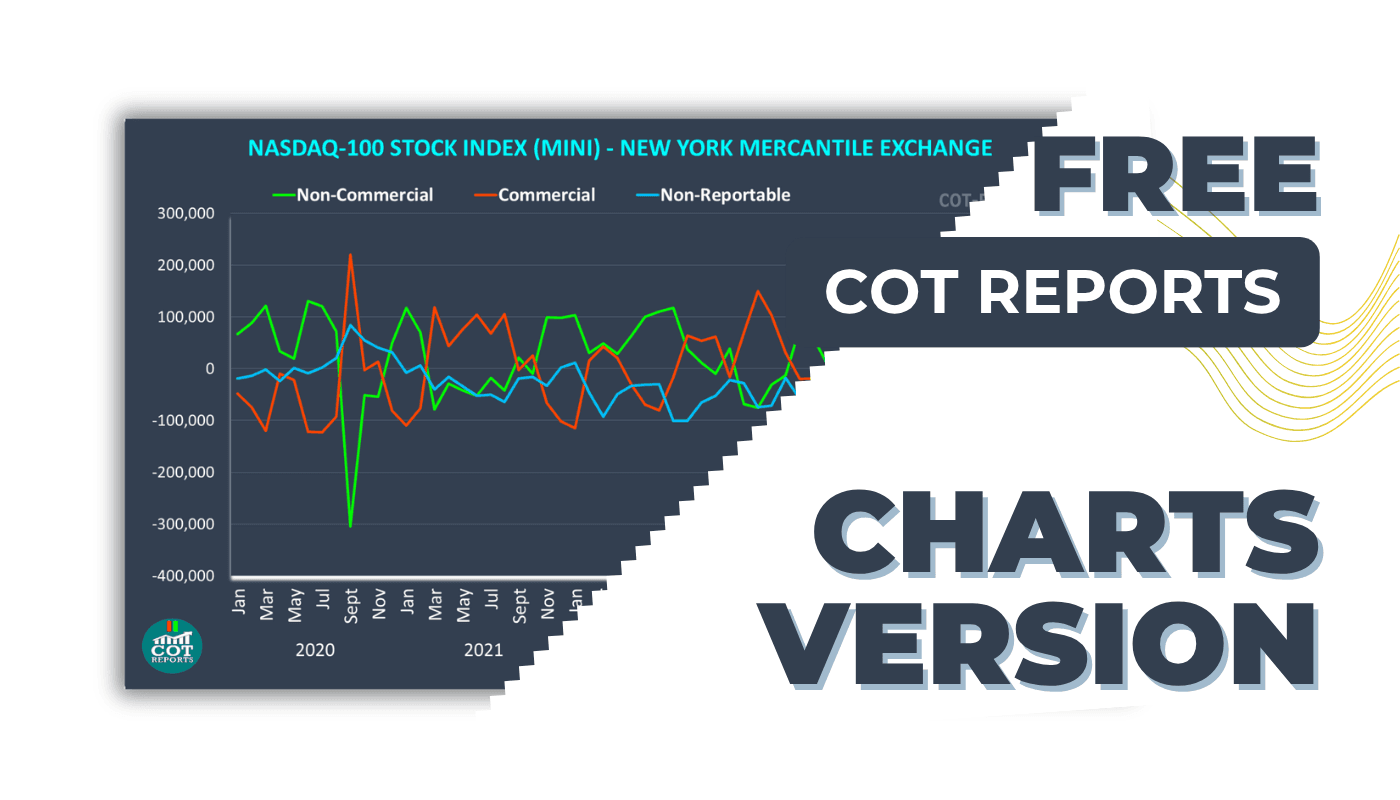
Visual COT data: Net positions over time, Long vs Short bars, and trend analysis.

View Charts COT Report

More COT Report Formats

PREMIUM

Unlock Every COT Report Format.
Every COT Report with Advanced Analytics

Go beyond the free reports: the Disaggregated, TFF and Supplemental formats with 20+ years of history, plus the Positioning Heatmap, Advanced Charts and CSV export.

CFTC REPORT FORMATS

  • ✓+380 CFTC Markets — Every Commodity & Financial Future
  • ✓Futures-Only Reports (Legacy)
  • ✓Disaggregated Futures & Options Combined
  • ✓Traders in Financial Futures (TFF)
  • ✓Supplemental — Commodity Index Traders

DATA & TOOLS

  • ✓20+ Years of Historical COT Data
  • ✓Managed Money & Leveraged Funds Positioning
  • ✓Download CSV Historical COT Data
  • ✓Price Overlay on Charts
  • ✓Extra COT Report Tables & Visualizations
Go PremiumFrom $3.50/week · $14/month · Cancel any time

Brokers

Start with twice the capital

Curated broker partners we know, use and recommend. Bonus offers, account transfers and live conditions reviewed by our team — not a random affiliate list.

View all brokers
Ultima MarketsExclusive Offer

100% First Deposit Bonus

Open a live account through COT-Reports and receive a VIP bonus credited directly to your MT4/MT5 trading account. This exclusive offer is not available on the official Ultima Markets website.

Get free access to TradeLog · 1 month free Premium with your first deposit

100% VIP BonusCredited to MT4/MT5Tight SpreadsRegulatedFree TradeLog
Open a Live Account Deposit $500 · Get $1,000 in your account · Use TradeLog for FREE
TradeLog

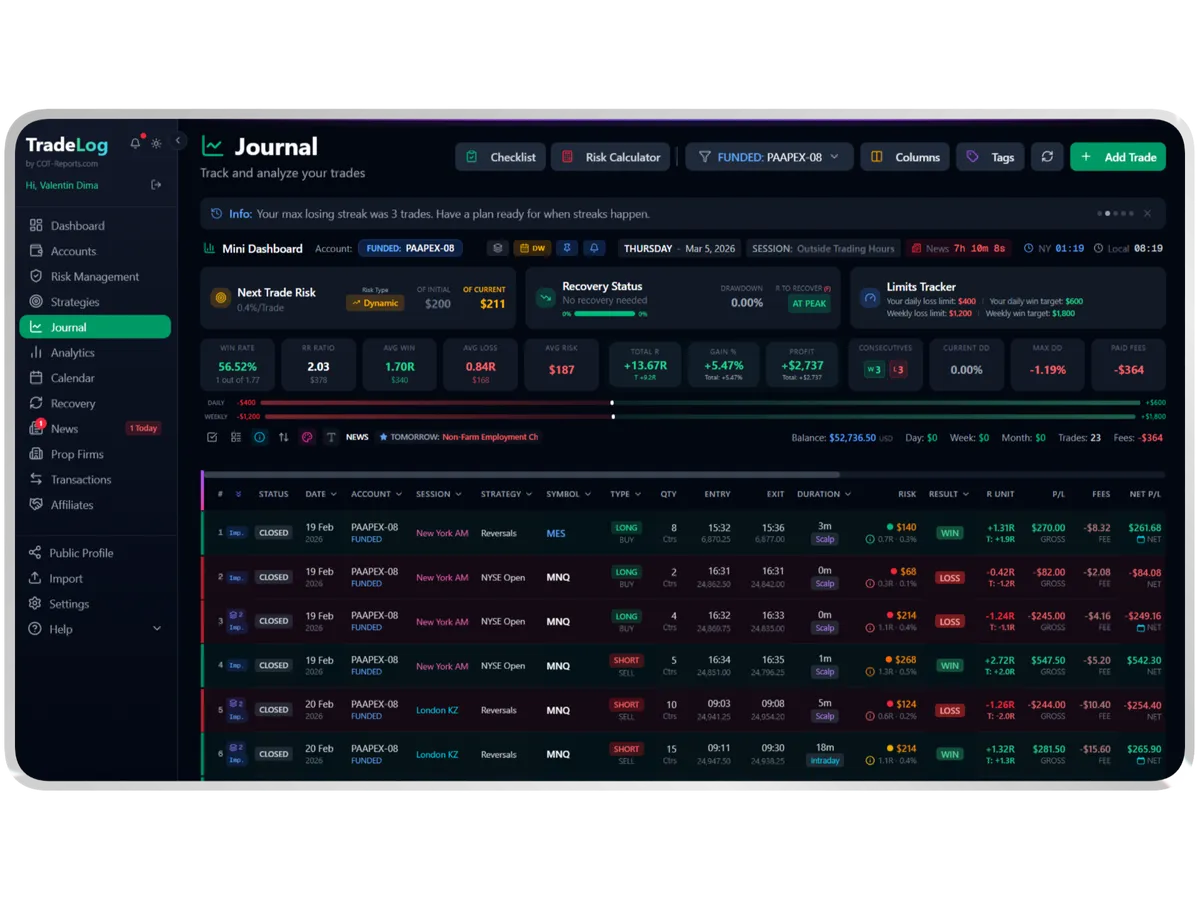
Auto-sync trades from MetaTrader, NinjaTrader, cTrader, Tradovate and more. Built-in analytics, prop-firm tracking, risk management and multi-account support. Includes free EAs, free cBot and free NT Add-On.

MT4MT5NinjaTradercTraderTradovateDXtradeRithmicTradingViewBinanceOKXBybitMore
Get Started for Free From $19/mo · 14-day free trial

Join 12,000+ Traders on Telegram

Free COT reports delivered every Friday. Request reports on demand, track your trades, and access exclusive tools.