


COT Report Comparison
Two markets, side by side · Updated every Friday
Compare two markets' positioning at a glance: net positions, weekly changes, percentile ranks. Pick any pair from the tracked CFTC markets — currencies vs commodities, metals vs equity indices, two energies head-to-head.
Both markets share the same time period and sort order.
Both markets share the same time period and sort order.

| DATE | LONG | SHORT | NET POS | CHANGE | %OI L. | %OI S. | OI |
|---|---|---|---|---|---|---|---|
| 21 Apr 26 | 212,893 | 48,887 | 164,006 | +1,480 | 58.2% | 13.4% | 365,842 |
| 28 Apr 26 | 211,818 | 52,247 | 159,571 | -4,435 | 57.3% | 14.1% | 369,530 |
| 5 May 26 | 211,814 | 48,511 | 163,303 | +3,732 | 57.6% | 13.2% | 367,932 |
| 12 May 26 | 219,793 | 48,171 | 171,622 | +8,319 | 58.4% | 12.8% | 376,496 |
| 19 May 26 | 211,018 | 51,185 | 159,833 | -11,789 | 55.6% | 13.5% | 379,325 |
| 26 May 26 | 200,704 | 46,444 | 154,260 | -5,573 | 56.8% | 13.1% | 353,489 |
| 2 Jun 26 | 206,096 | 30,076 | 176,020 | +21,760 | 63.2% | 9.2% | 326,052 |
| 9 Jun 26 | 207,984 | 34,147 | 173,837 | -2,183 | 62.5% | 10.3% | 332,709 |
| 16 Jun 26 | 211,127 | 30,907 | 180,220 | +6,383 | 62.2% | 9.1% | 339,330 |
| 23 Jun 26 | 217,028 | 35,689 | 181,339 | +1,119 | 61.6% | 10.1% | 352,167 |
| 30 Jun 26 | 229,619 | 35,600 | 194,019 | +12,680 | 62.1% | 9.6% | 369,541 |
| 7 Jul 26 | 233,713 | 39,467 | 194,246 | +227 | 62.9% | 10.6% | 371,776 |
| 14 Jul 26 | 227,310 | 40,628 | 186,682 | -7,564 | 59.2% | 10.6% | 383,689 |
| 21 Jul 26 | 224,785 | 40,875 | 183,910 | -2,772 | 58.6% | 10.7% | 383,368 |
| 28 Jul 26 | 219,622 | 37,552 | 182,070 | -1,840 | 57.1% | 9.8% | 384,603 |
| 4 Aug 26 | 227,013 | 29,379 | 197,634 | +15,564 | 61.1% | 7.9% | 371,551 |
| 11 Aug 26 | 250,936 | 32,996 | 217,940 | +20,306 | 62.7% | 8.2% | 400,309 |
| 18 Aug 26 | 256,902 | 34,713 | 222,189 | +4,249 | 63.2% | 8.5% | 406,260 |
| 25 Aug 26 | 277,159 | 33,825 | 243,334 | +21,145 | 64.8% | 7.9% | 427,957 |
| 1 Sep 26 | 260,485 | 32,361 | 228,124 | -15,210 | 62.7% | 7.8% | 415,196 |
| 8 Sep 26 | 261,007 | 29,047 | 231,960 | +3,836 | 63.5% | 7.1% | 411,227 |
| 15 Sep 26 | 258,059 | 27,721 | 230,338 | -1,622 | 63.0% | 6.8% | 409,899 |
| 22 Sep 26 | 253,982 | 28,129 | 225,853 | -4,485 | 61.5% | 6.8% | 412,800 |
| 29 Sep 26 | 249,736 | 31,104 | 218,632 | -7,221 | 61.4% | 7.7% | 406,456 |
| 6 Oct 26 | 245,403 | 35,068 | 210,335 | -8,297 | 62.0% | 8.9% | 396,109 |
| 13 Oct 26 | 245,300 | 37,421 | 207,879 | -2,456 | 61.9% | 9.4% | 396,345 |
| DATE | LONG | SHORT | NET POS | CHANGE | %OI L. | %OI S. | OI |
|---|---|---|---|---|---|---|---|
| 21 Apr 26 | 17,617 | 12,634 | 4,983 | -187 | 57.5% | 41.2% | 30,651 |
| 28 Apr 26 | 17,180 | 12,672 | 4,508 | -475 | 56.1% | 41.4% | 30,611 |
| 5 May 26 | 17,048 | 16,355 | 693 | -3,815 | 52.5% | 50.3% | 32,496 |
| 12 May 26 | 18,912 | 15,725 | 3,187 | +2,494 | 58.9% | 49.0% | 32,108 |
| 19 May 26 | 21,403 | 21,882 | -479 | -3,666 | 52.7% | 53.9% | 40,626 |
| 26 May 26 | 22,732 | 21,882 | 850 | +1,329 | 53.8% | 51.8% | 42,278 |
| 2 Jun 26 | 24,584 | 20,826 | 3,758 | +2,908 | 57.1% | 48.3% | 43,090 |
| 9 Jun 26 | 27,908 | 26,524 | 1,384 | -2,374 | 55.5% | 52.7% | 50,285 |
| 16 Jun 26 | 31,180 | 17,983 | 13,197 | +11,813 | 63.1% | 36.4% | 49,411 |
| 23 Jun 26 | 34,278 | 21,350 | 12,928 | -269 | 62.4% | 38.9% | 54,908 |
| 30 Jun 26 | 32,524 | 19,508 | 13,016 | +88 | 59.9% | 35.9% | 54,306 |
| 7 Jul 26 | 31,921 | 18,652 | 13,269 | +253 | 59.8% | 34.9% | 53,384 |
| 14 Jul 26 | 31,641 | 18,468 | 13,173 | -96 | 59.4% | 34.7% | 53,293 |
| 21 Jul 26 | 33,270 | 17,656 | 15,614 | +2,441 | 61.7% | 32.7% | 53,953 |
| 28 Jul 26 | 35,339 | 18,142 | 17,197 | +1,583 | 60.7% | 31.1% | 58,251 |
| 4 Aug 26 | 35,247 | 12,748 | 22,499 | +5,302 | 67.6% | 24.4% | 52,154 |
| 11 Aug 26 | 32,651 | 11,242 | 21,409 | -1,090 | 65.9% | 22.7% | 49,541 |
| 18 Aug 26 | 29,582 | 10,503 | 19,079 | -2,330 | 61.7% | 21.9% | 47,928 |
| 25 Aug 26 | 29,042 | 10,360 | 18,682 | -397 | 60.6% | 21.6% | 47,953 |
| 1 Sep 26 | 28,240 | 11,215 | 17,025 | -1,657 | 56.5% | 22.4% | 50,020 |
| 8 Sep 26 | 28,407 | 10,803 | 17,604 | +579 | 49.1% | 18.7% | 57,858 |
| 15 Sep 26 | 25,971 | 15,378 | 10,593 | -7,011 | 59.4% | 35.2% | 43,744 |
| 22 Sep 26 | 27,768 | 17,438 | 10,330 | -263 | 59.9% | 37.6% | 46,328 |
| 29 Sep 26 | 29,742 | 17,861 | 11,881 | +1,551 | 61.5% | 36.9% | 48,342 |
| 6 Oct 26 | 30,526 | 18,515 | 12,011 | +130 | 59.7% | 36.2% | 51,095 |
| 13 Oct 26 | 32,596 | 19,677 | 12,919 | +908 | 62.9% | 38.0% | 51,816 |
Currently showing: GOLD (GC) vs US DOLLAR INDEX (DX) | 13 Oct 2026 | Futures Only
About COT Comparison
COT Comparison loads two CFTC futures markets side-by-side with synchronised time periods so you can compare Non-Commercial positioning, weekly changes and percent of open interest between, for example, EUR/USD vs USD Index, Gold vs Silver, or Crude Oil vs Natural Gas — useful for cross-asset positioning analysis.
- Source: U.S. Commodity Futures Trading Commission (CFTC)
- Release schedule: Every Friday, 3:30 PM ET (delayed on US federal holidays)
- Markets covered: Any two CFTC futures markets at once
- Trader categories: Non-Commercial net, weekly change, % open interest
Frequently Asked Questions
What is the COT Comparison page?
COT Comparison loads any two CFTC futures markets side-by-side with synchronised dates. It is designed for cross-asset positioning analysis — for example comparing Euro vs US Dollar Index speculative positioning, Gold vs Silver, Crude Oil vs Natural Gas, or correlated currency pairs.
How does COT comparison work?
Pick a primary market and a secondary market from the searchable selectors. The page fetches both markets' weekly Non-Commercial positioning histories and aligns them on the same timeline. You can switch the time period (year-to-date through 10 years) and the comparison metric (net position, weekly change, percentage of open interest).
Which markets can I compare?
All 380 CFTC-tracked futures markets are available for comparison. Common cross-comparisons include EUR vs USD Index, Gold vs Silver, WTI vs Brent crude oil, 10-year Notes vs 30-year Bonds, and S&P 500 vs Nasdaq 100 for equity-index relative positioning.
Are longer time periods available?
Year-to-date, 3-month and 6-month comparisons are free for all visitors. 1-year through 10-year periods unlock with a free account. Premium accounts get full historical depth and CSV export of the comparison dataset.
What insight does cross-market COT give me?
Cross-market positioning often reveals macro themes invisible in any single market — for example, hedge funds rotating from EUR longs into Japanese yen longs may signal a regime change in carry-trade dynamics. Comparison lets you visualise those rotations directly instead of inferring them from separate single-market views.
Explore All Report Formats
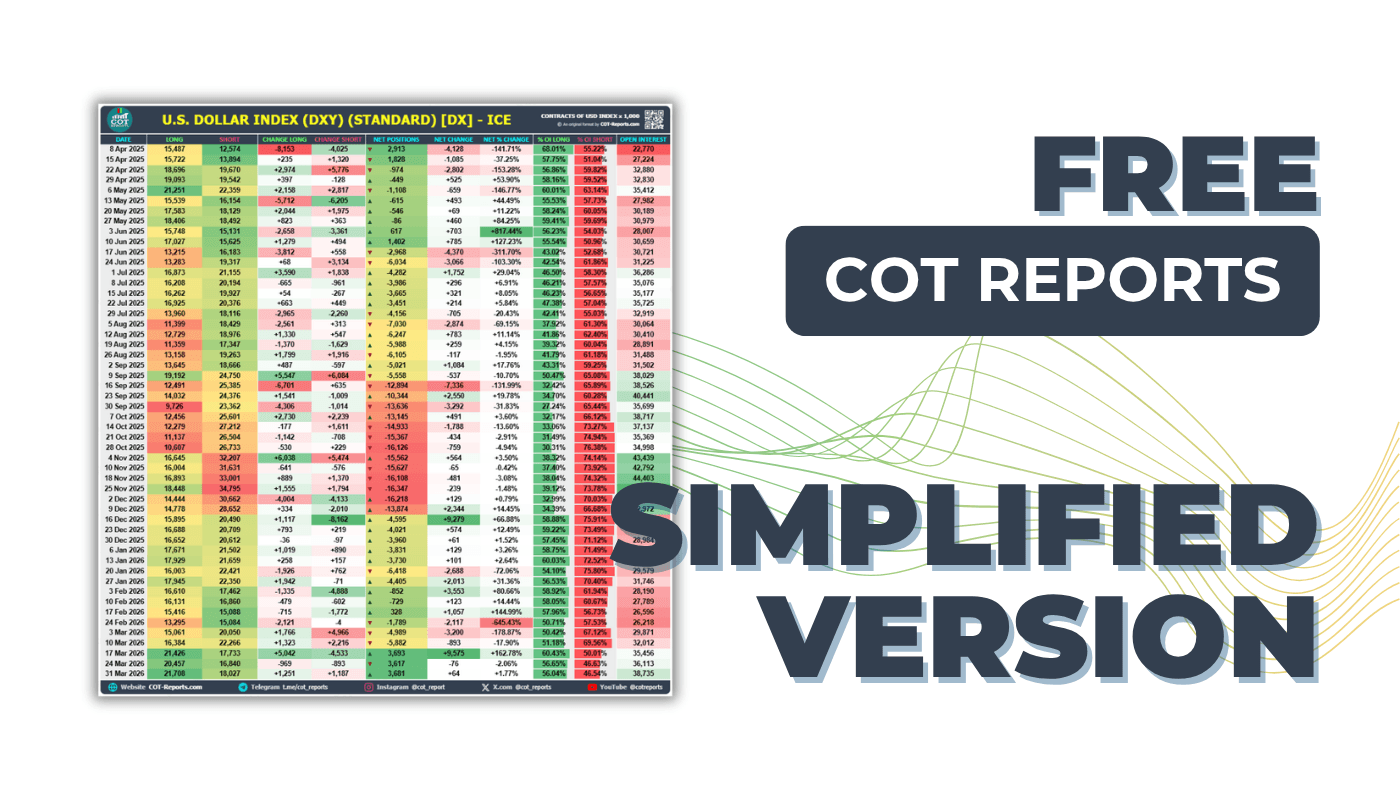
Simplified
Weekly data per market (6 months without an account, up to 10 years with a free one) with Non-Commercial, Commercial, and Non-Reportable positions.
View Simplified COT Report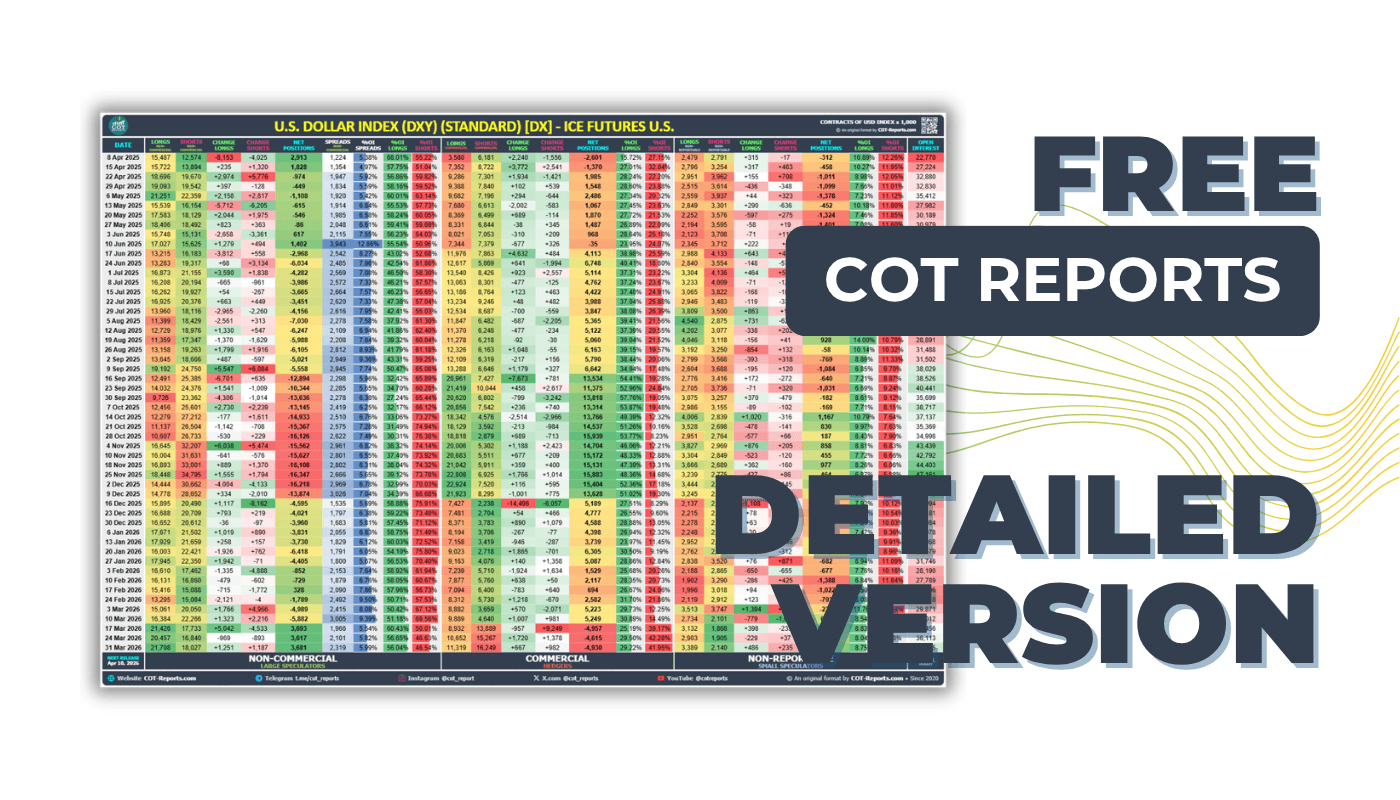
Detailed
Complete breakdown with Non-Commercial, Commercial, and Non-Reportable trader positions and changes.
View Detailed COT Report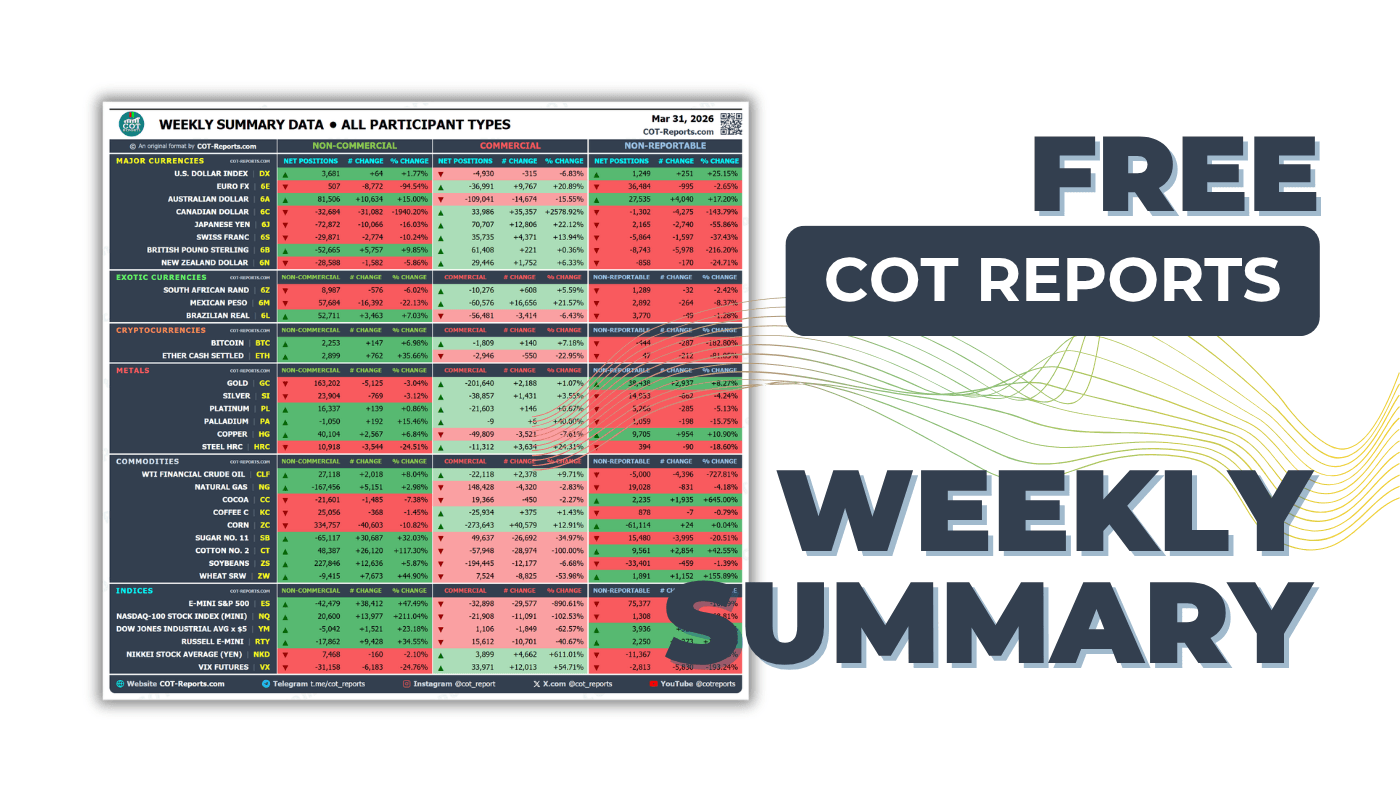
Weekly Summary
All positions at a glance. NET POSITIONS, % changes, and net/OI for all markets.
View Weekly Summary COT Report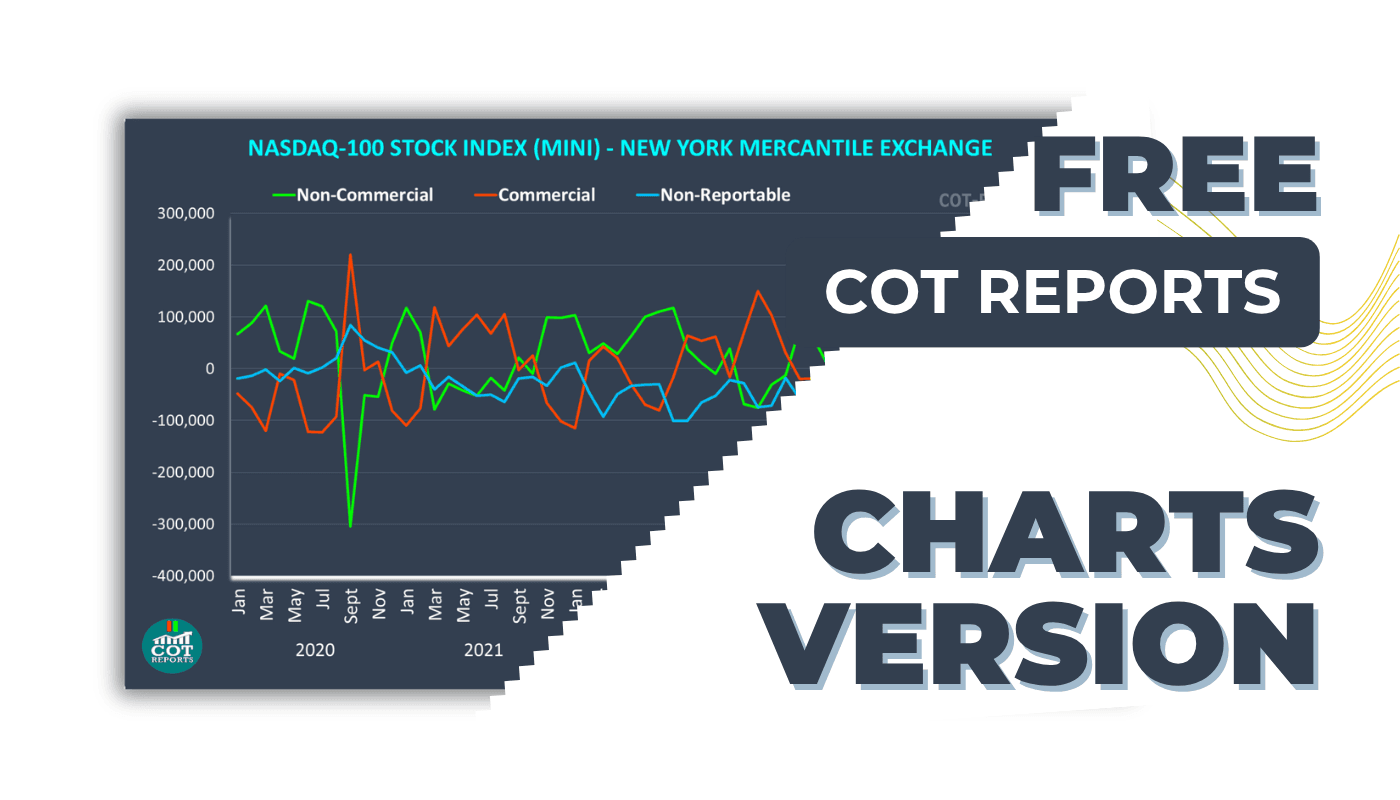
Charts
Visual COT data: Net positions over time, Long vs Short bars, and trend analysis.
View Charts COT ReportUnlock Every COT Report Format.
Every COT Report with Advanced Analytics
Go beyond the free Legacy reports: the Disaggregated, TFF and Supplemental formats, custom date ranges back to 1986, the Positioning Heatmap, Advanced Charts and CSV export.
REPORTS & HISTORY
- ✓Disaggregated — Managed Money & Swap Dealers
- ✓Traders in Financial Futures (TFF) — Leveraged Funds & Asset Managers
- ✓Supplemental — Commodity Index Traders
- ✓Simplified, Detailed & Latest views of all three
- ✓Custom date ranges, back to 1986
- ✓Both CFTC variants of every report, one click apart
DATA & TOOLS
- ✓Close Price column & CSV export
- ✓Every trader group's figures on the Positioning Heatmap
- ✓Advanced Charts & COT Volume Profile
- ✓Custom Weekly Summary & My Markets
- ✓Table screenshots (PNG) with no daily limit
- ✓The complete How to Read the Simplified COT Report guide (3-month and annual plans)
The 3-month and 1-year plans include the How to Read the Simplified COT Report guide free.


 Any Prop Firm.
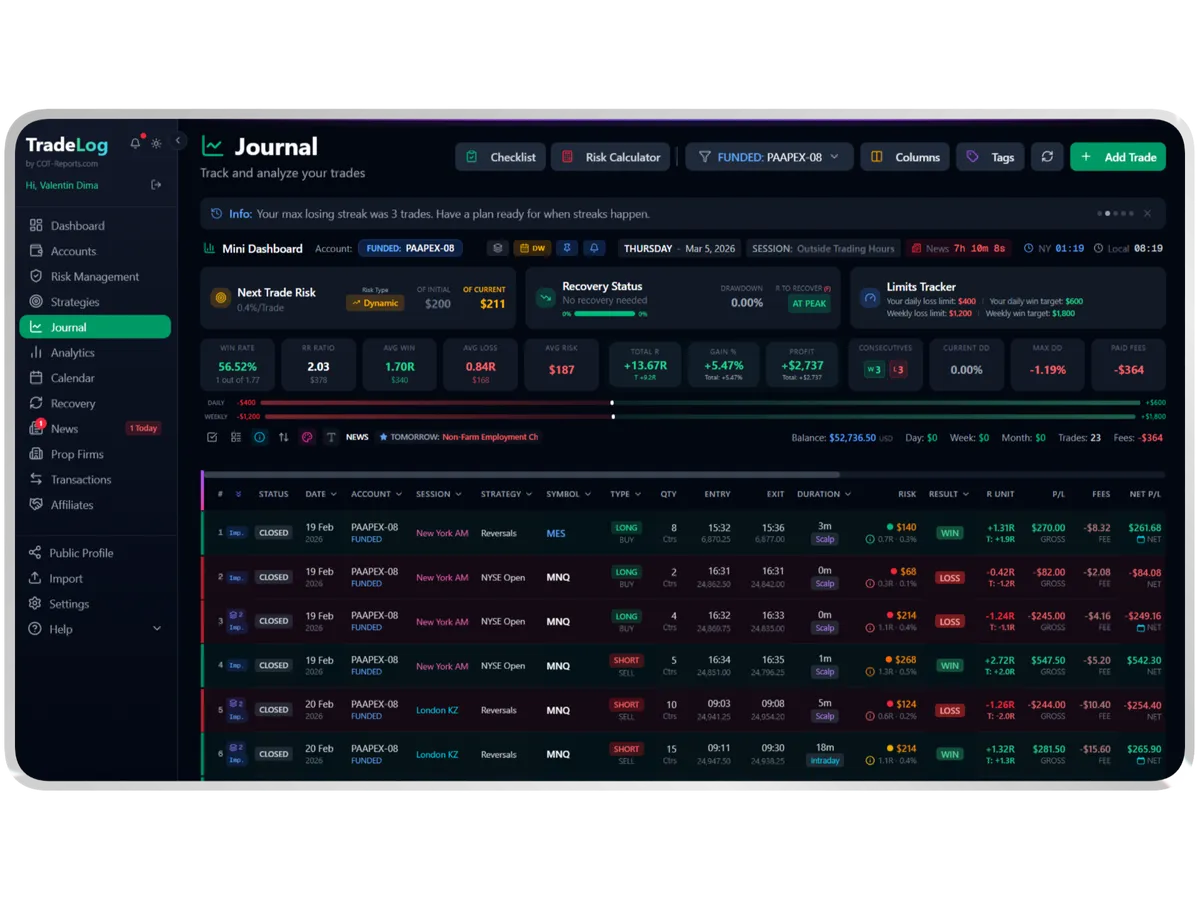
Automated Trading Journal
Auto-sync trades from MetaTrader, NinjaTrader, cTrader, Tradovate and more. Built-in analytics, prop-firm tracking, risk management and multi-account support. Basic and Premium include free EAs, a free cBot and a free NT Add-On.










COT-Reports Marketplace
Traders build it. Traders use it.
Probably the best trading tools, made by traders for the COT-Reports community. Buy what you need, or list what you built.
 COT-Reports.com
Every Friday, 35 markets land in Telegram. FREE.
The COT Report Simplified for each market in the map, plus the Weekly Summary, minutes after the CFTC publishes. Between Fridays, the bot sends any of them on request and keeps a free trading journal.