01Where do I start with reading the COT report?
+−
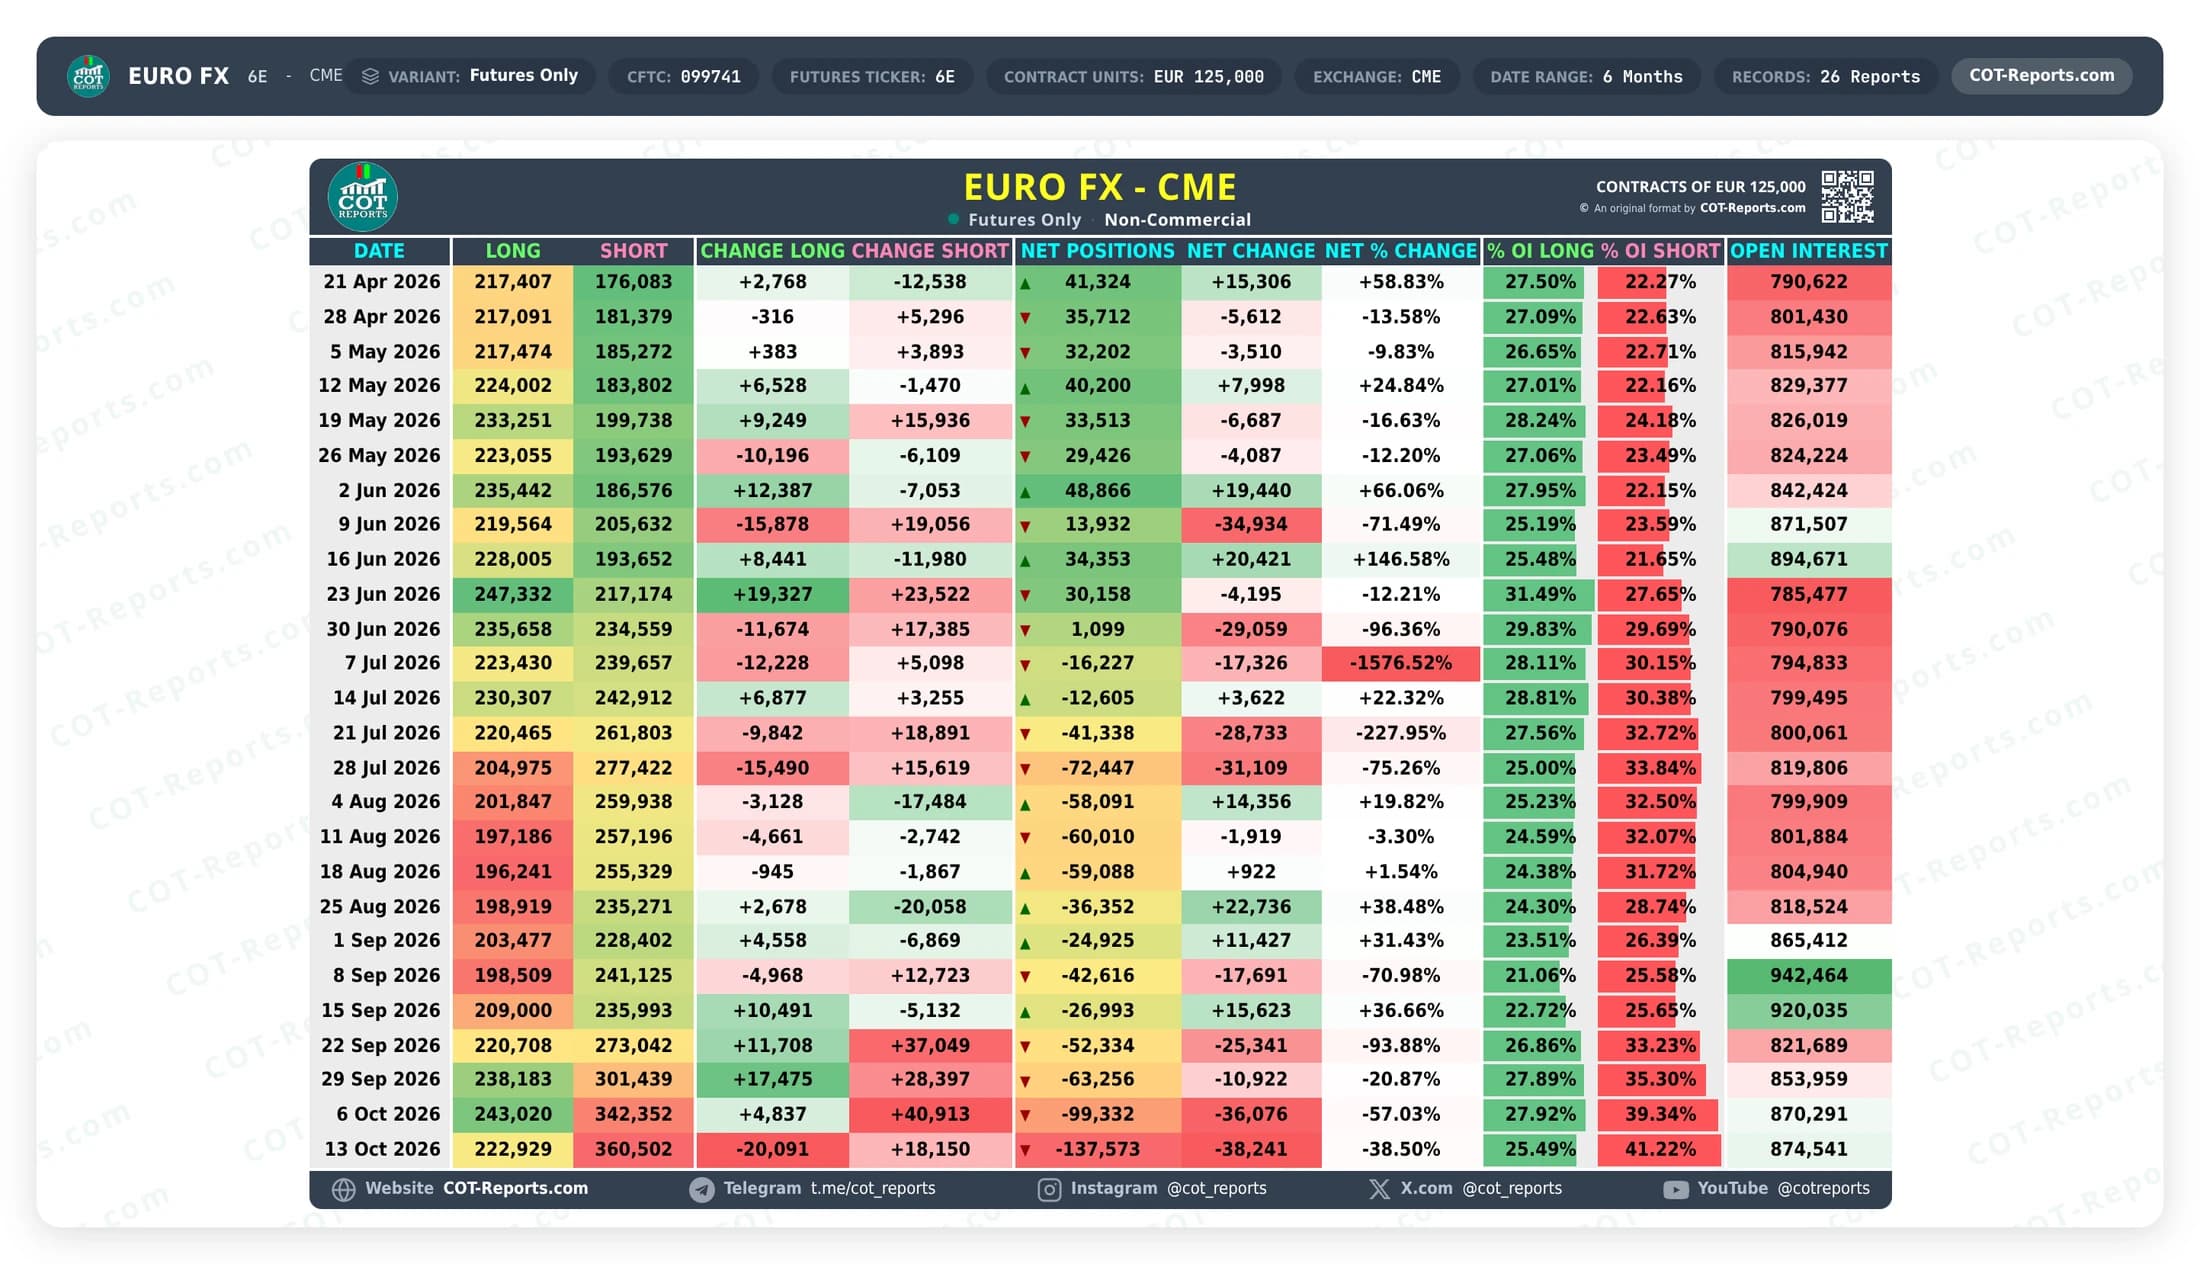
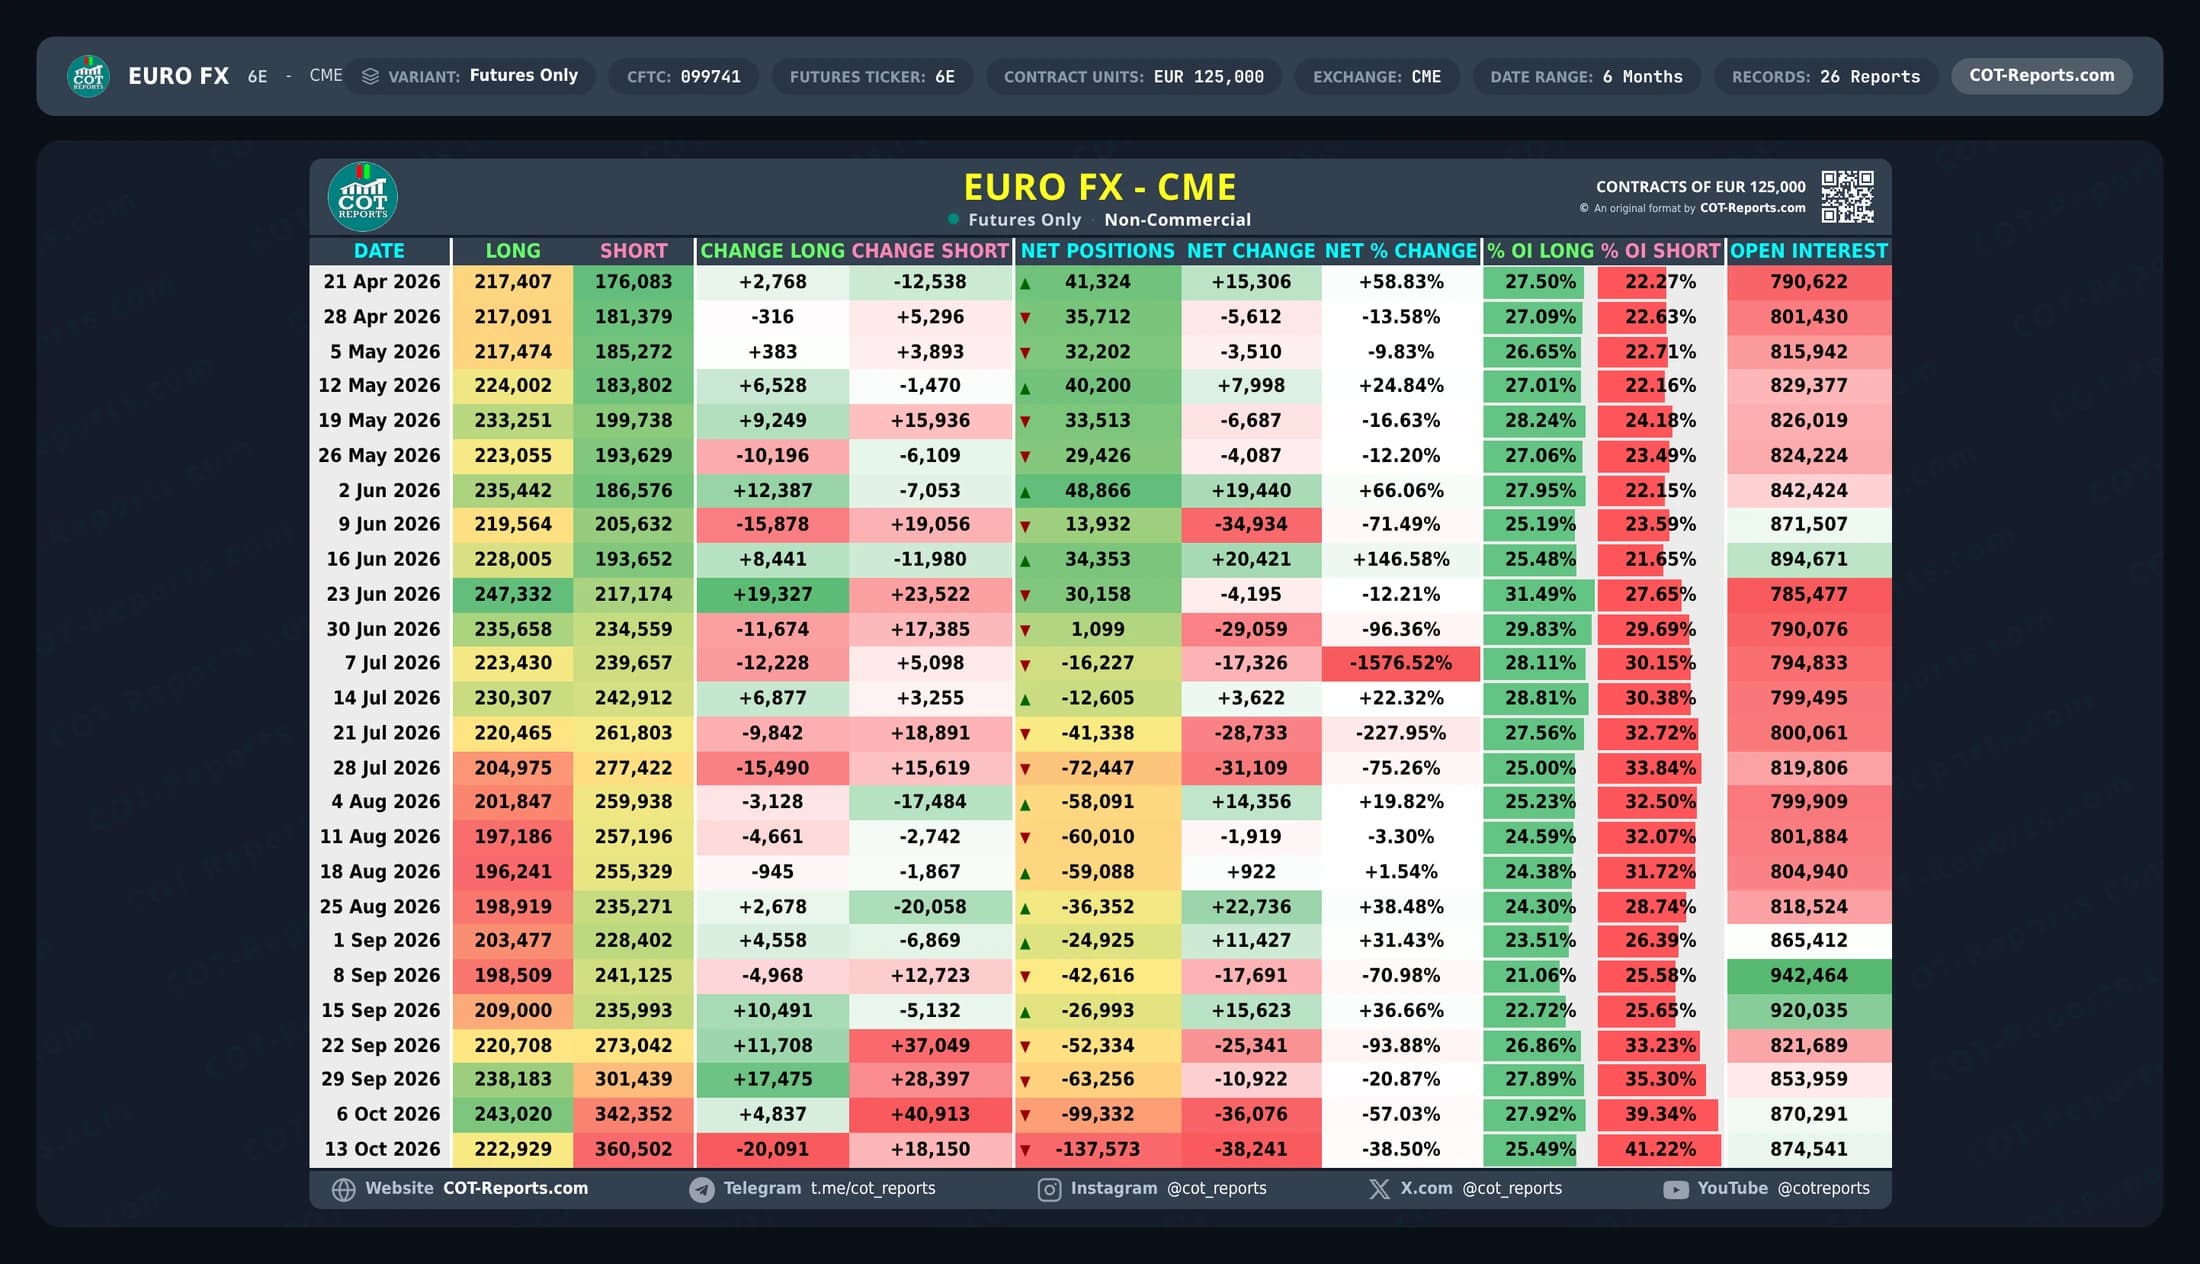
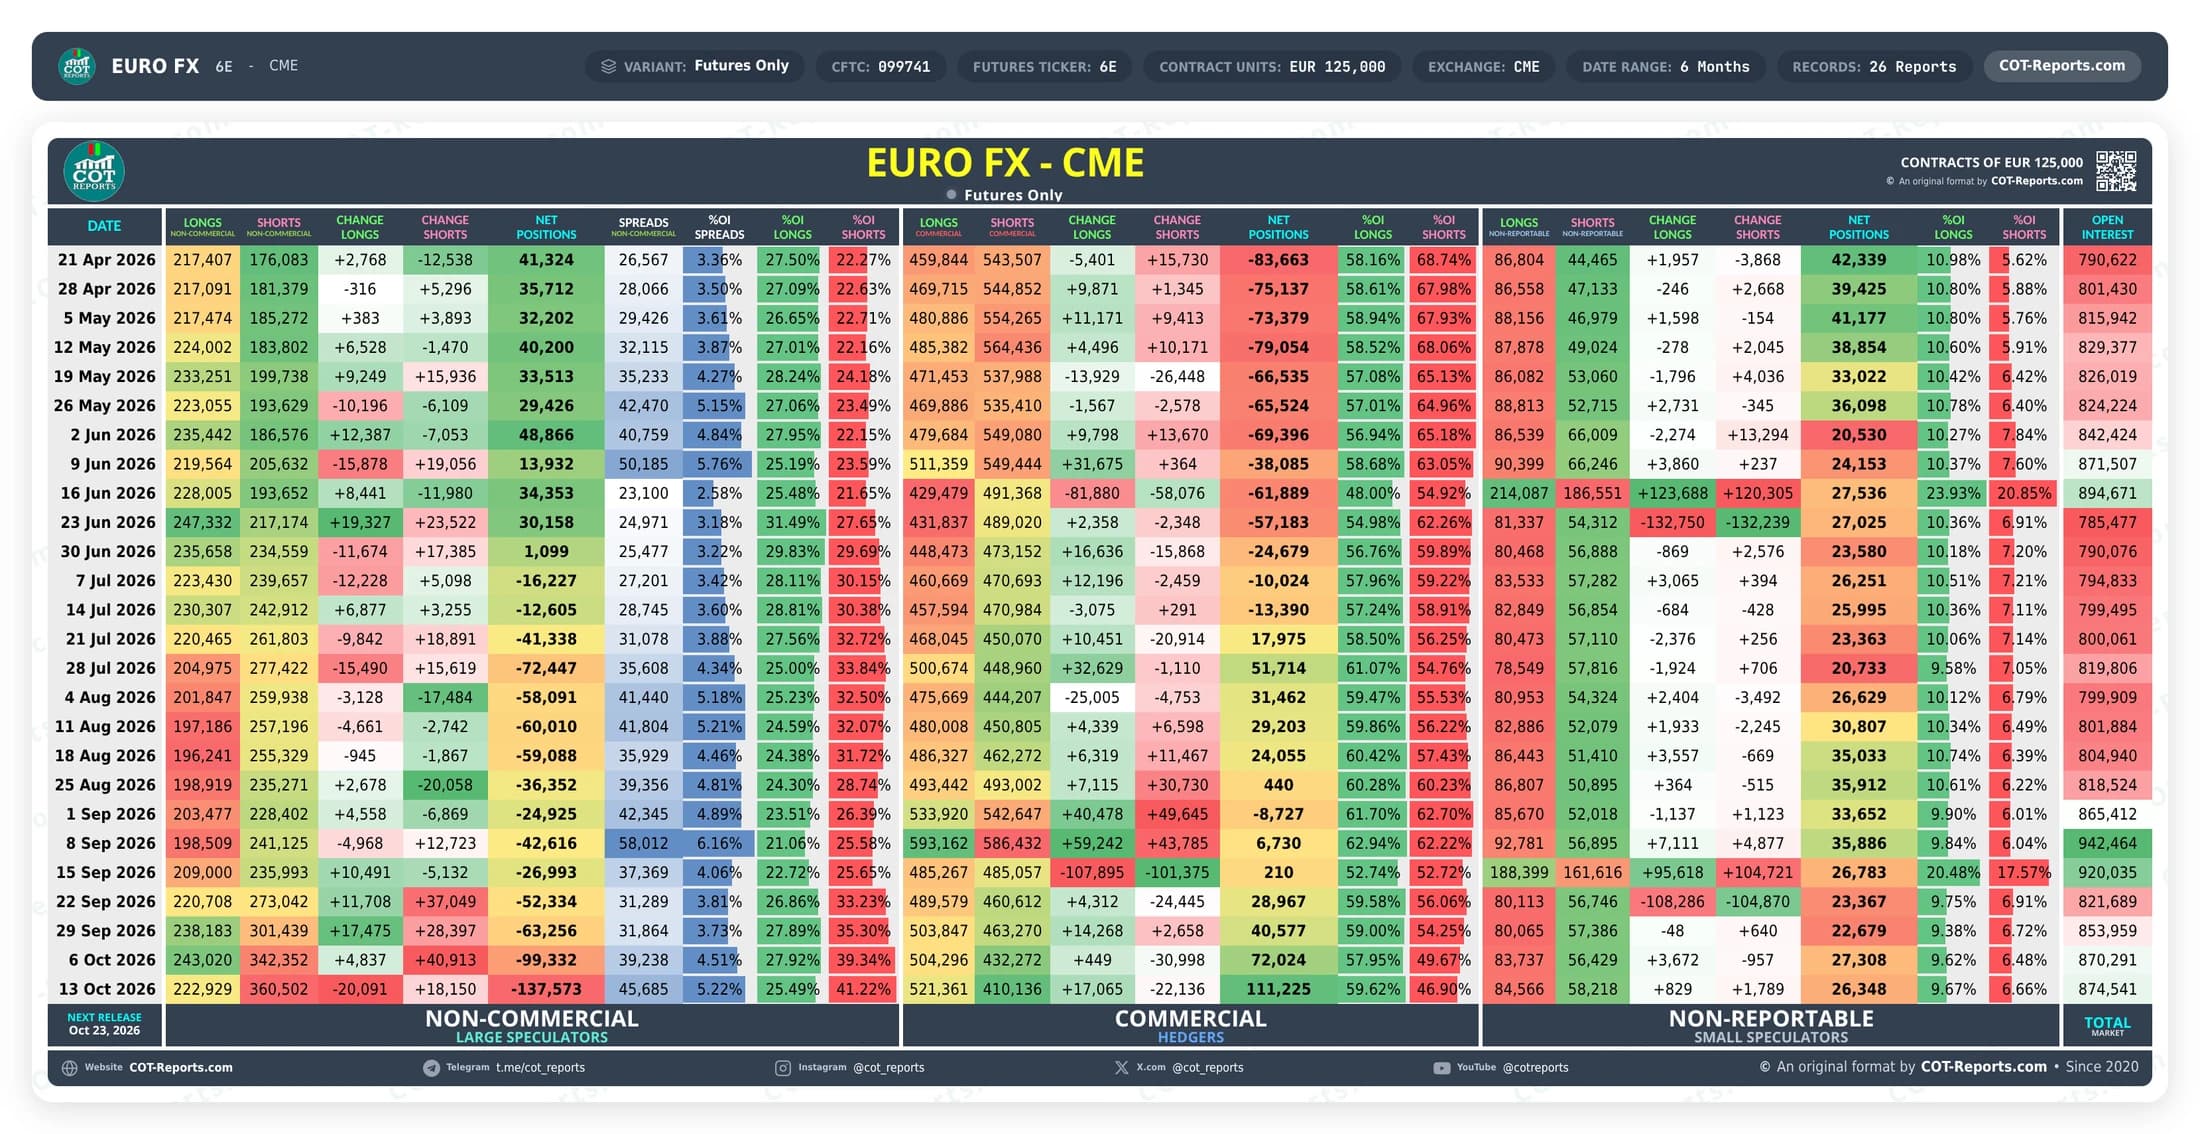
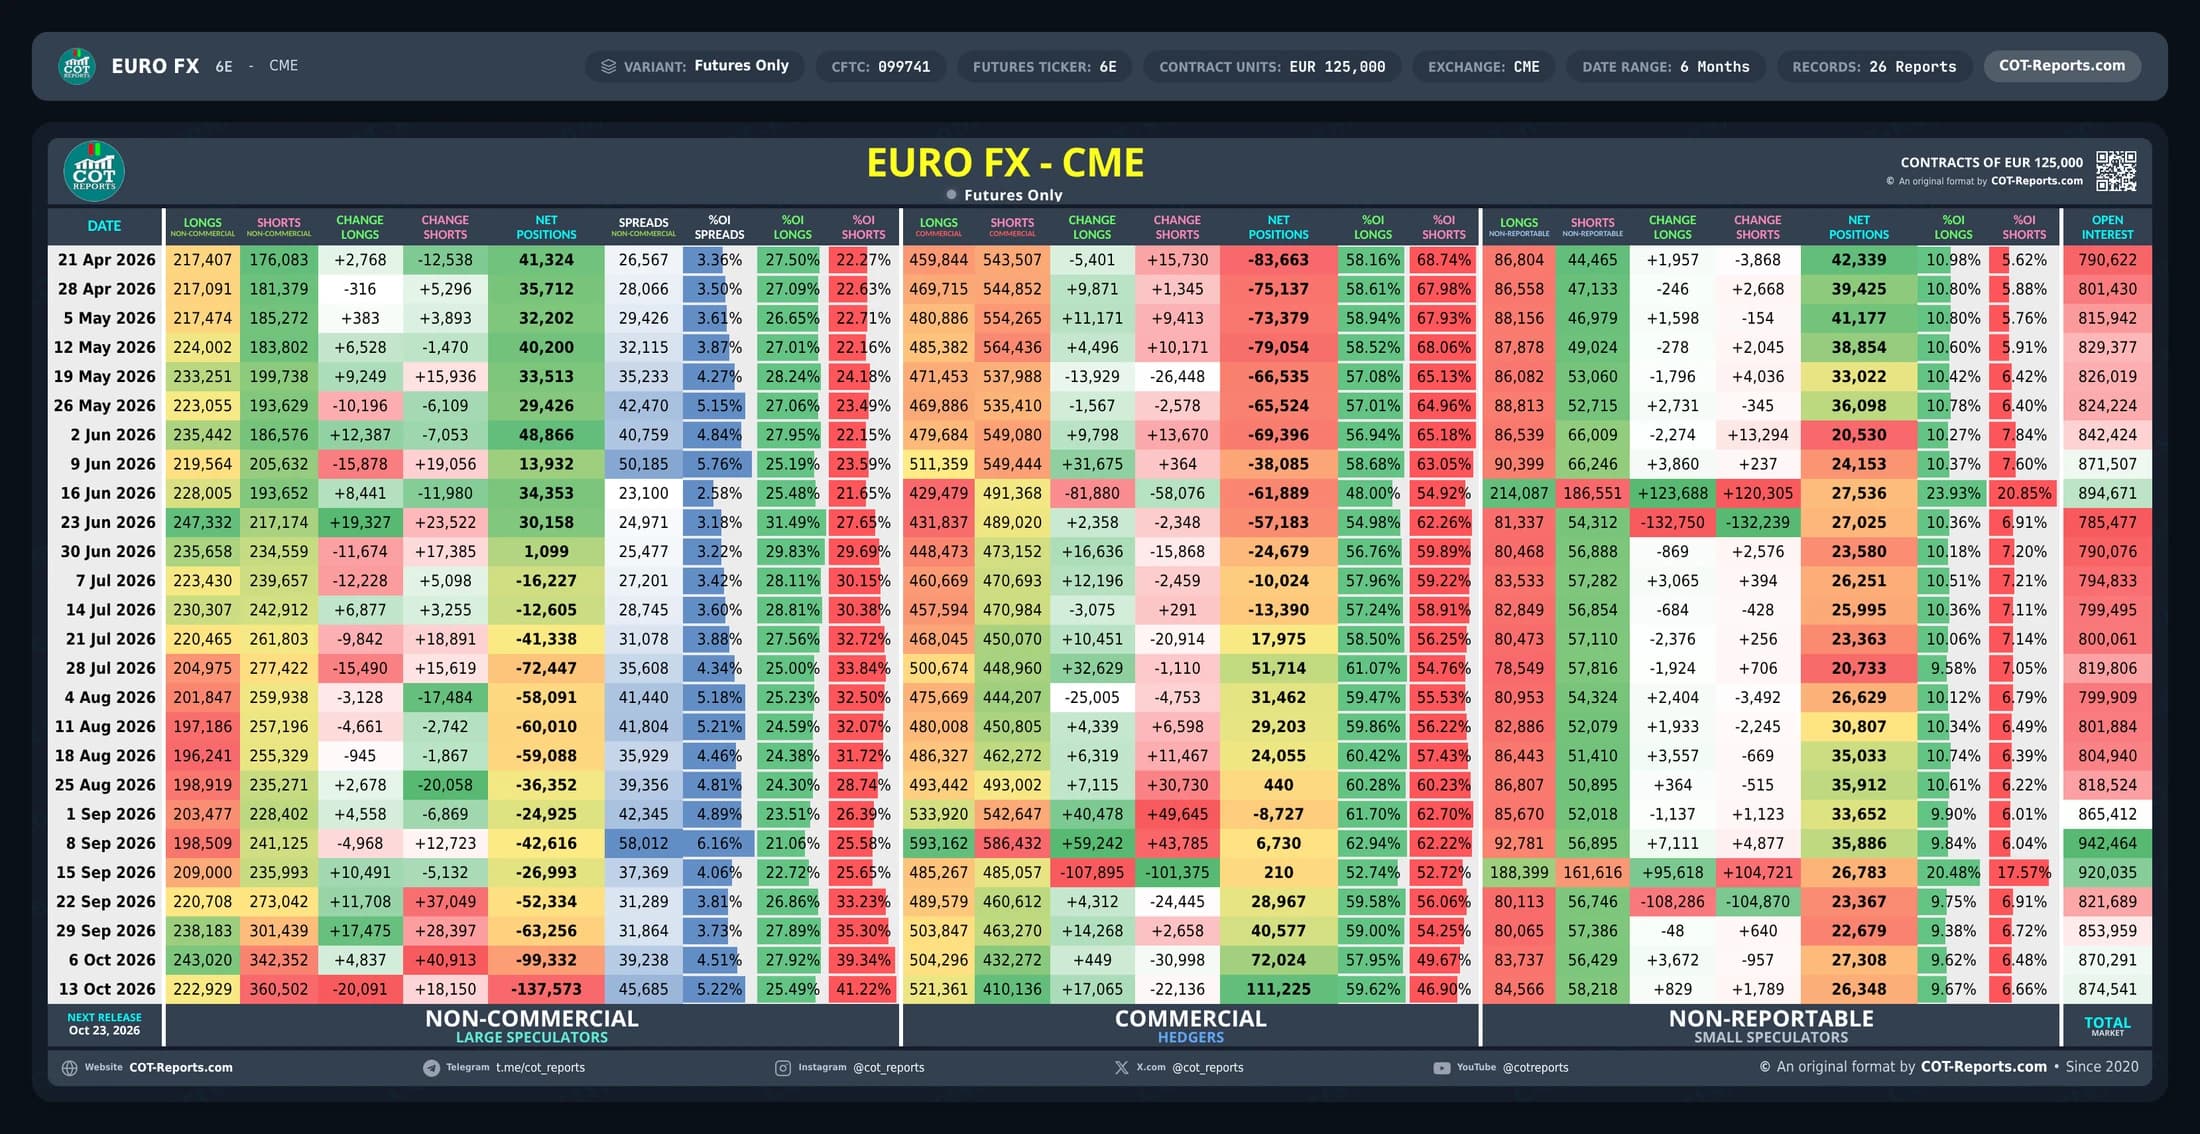
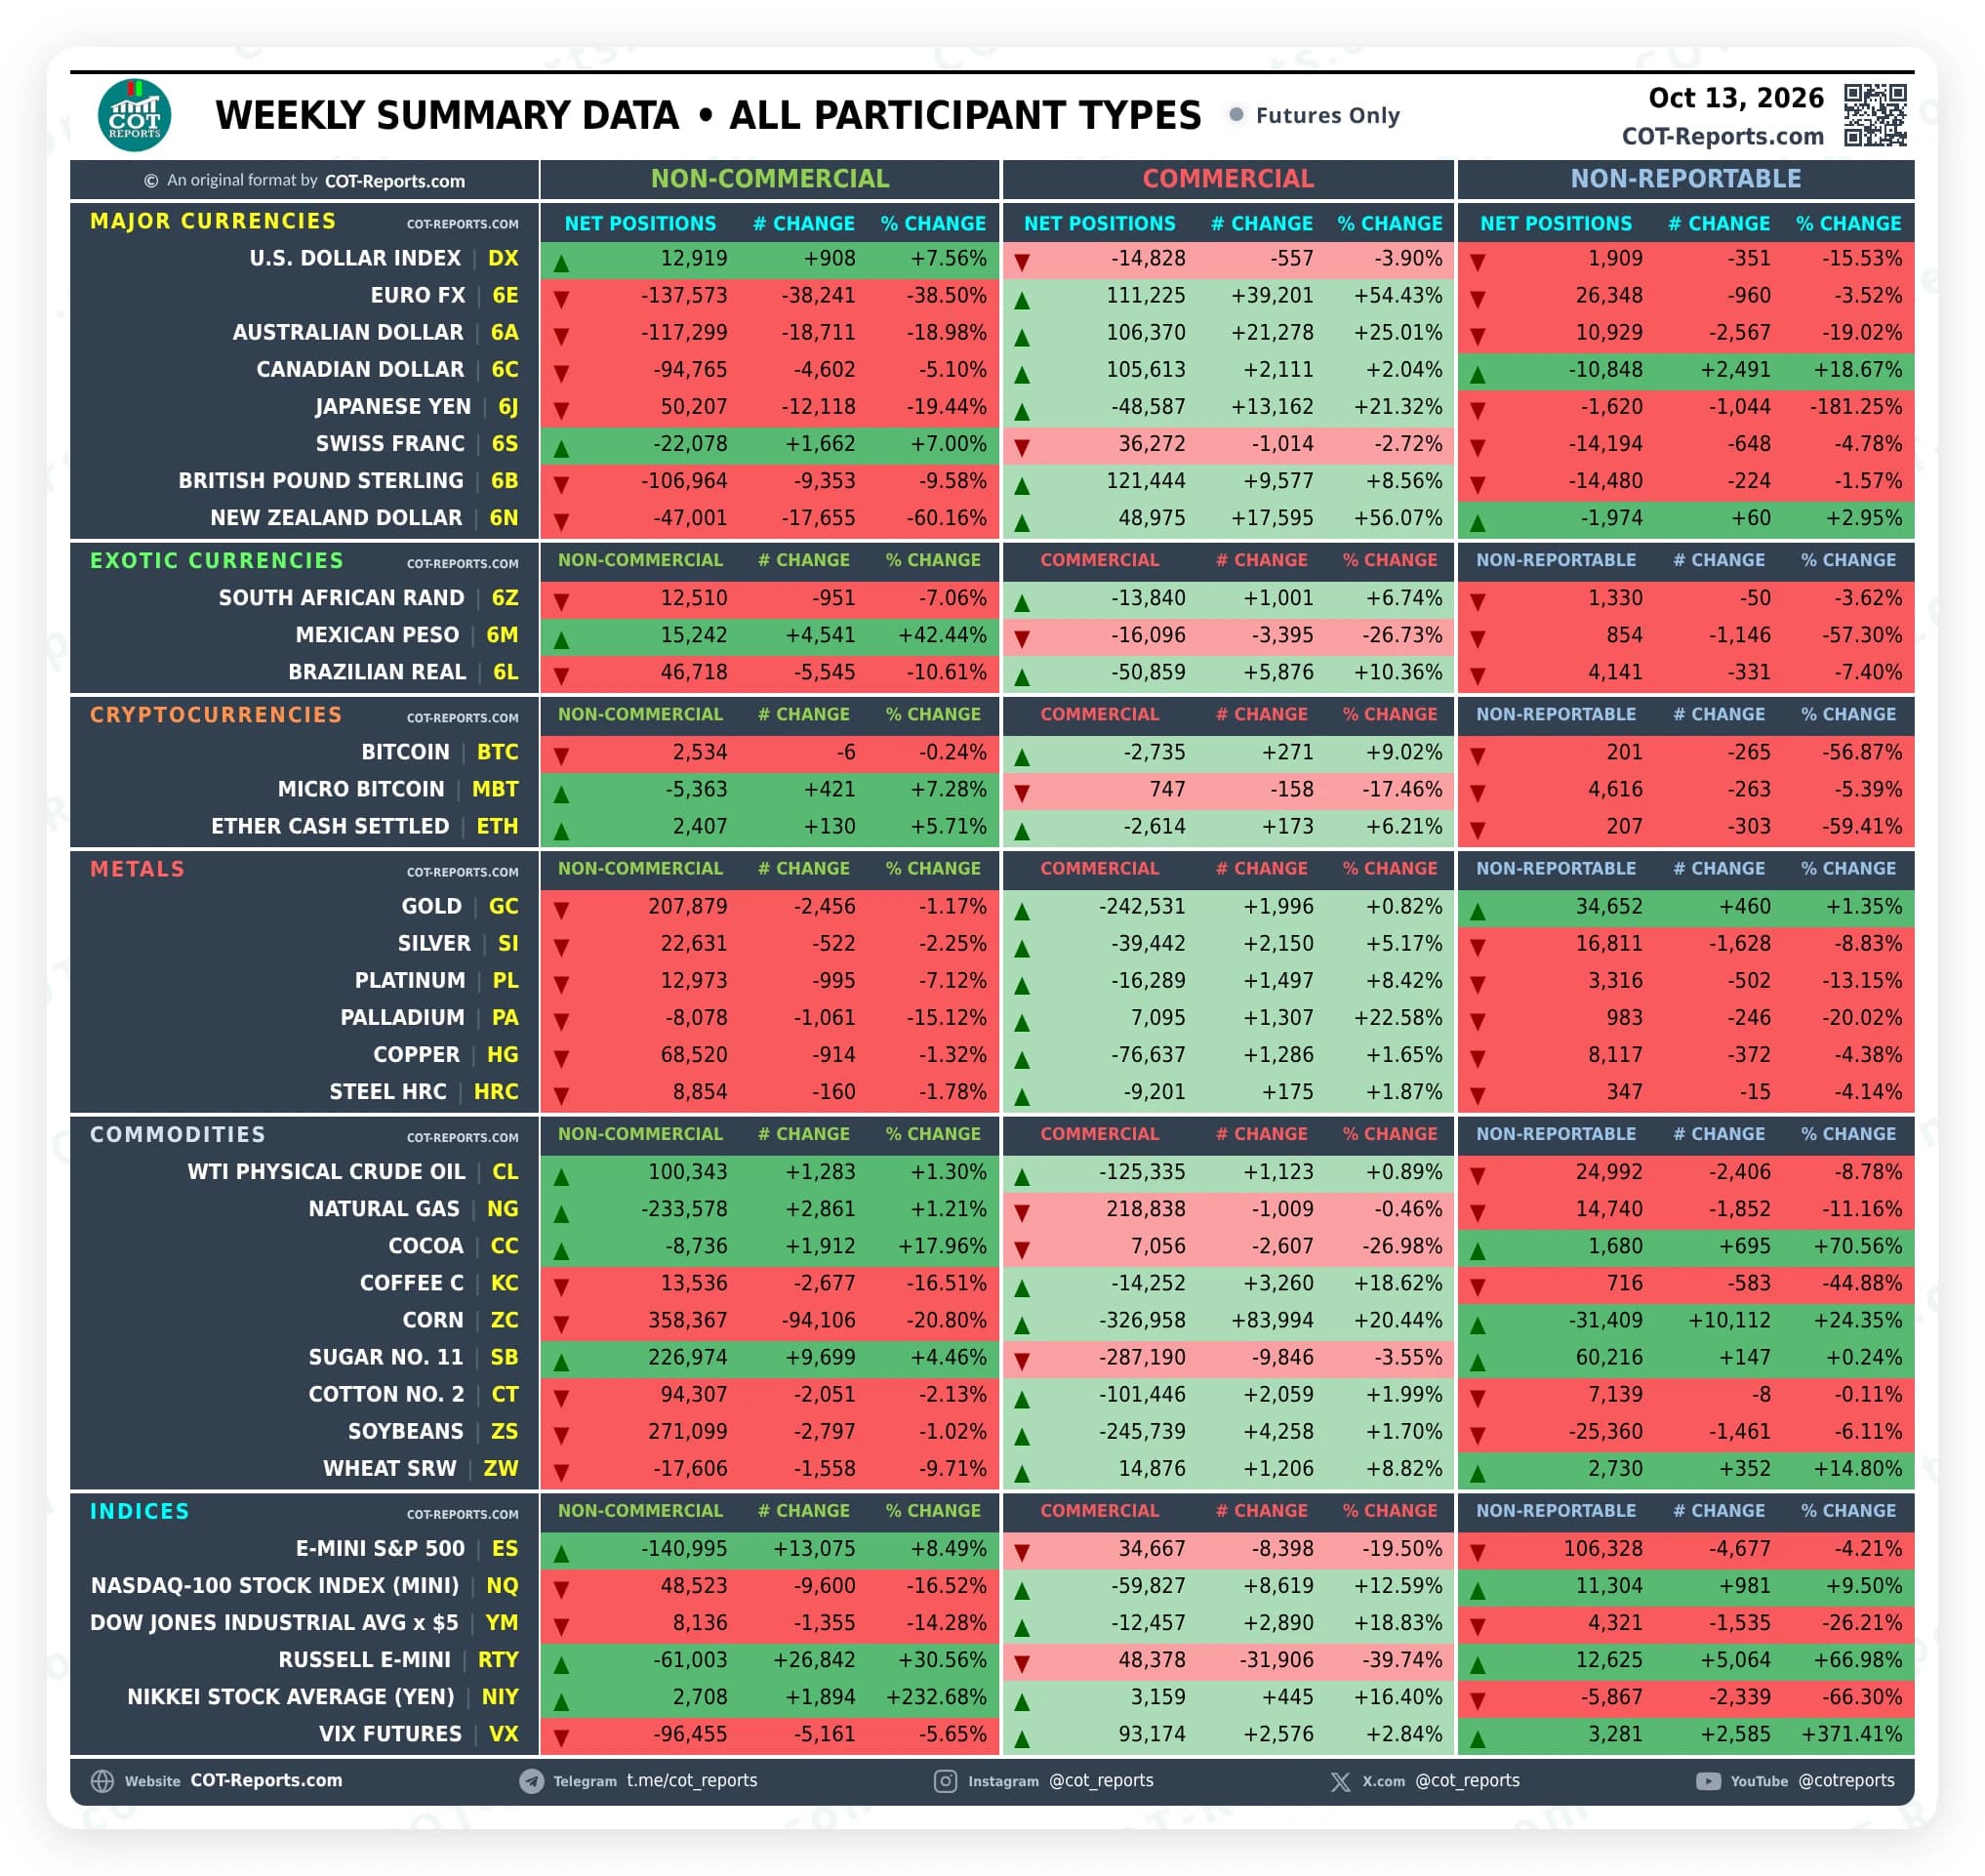
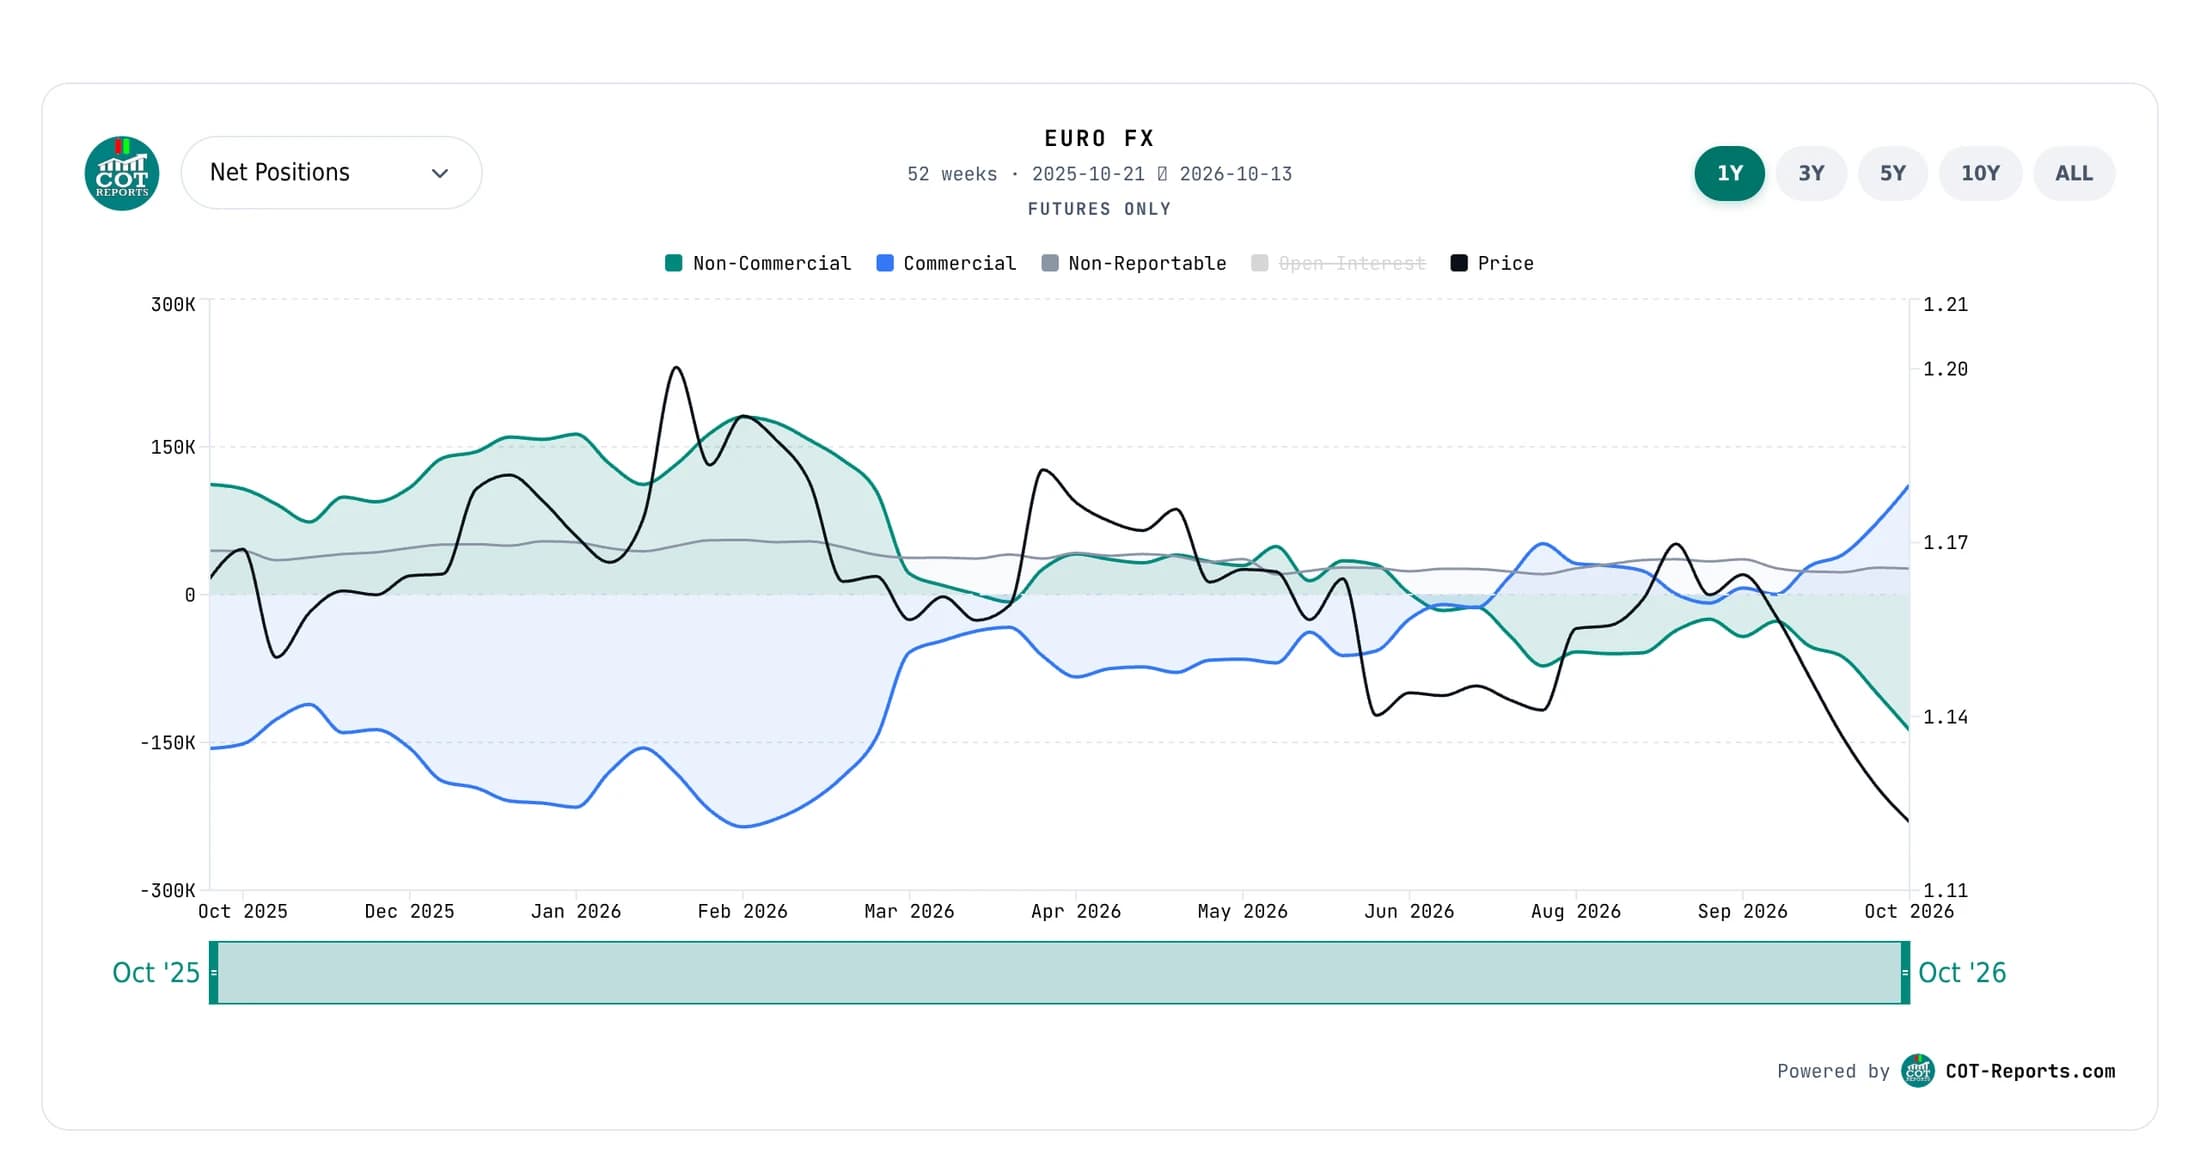
Start with the Legacy Futures Only format and one market you actually trade. Look at the Non-Commercial Net Position column — Long minus Short for large speculators. Track it weekly for 4-8 weeks and you will start to see how positioning shifts ahead of price moves.
02What does Non-Commercial mean in the COT report?
+−
Non-Commercials are large speculators — hedge funds, CTAs and other money managers whose positions exceed the CFTC reporting threshold — trading to profit from price moves rather than to hedge a business. Their net position (Long minus Short) is the most-watched line in the Legacy report.
03What's a COT extreme?
+−
A COT extreme occurs when a trader category's net position reaches the upper or lower end of its multi-year range — for example, Non-Commercial net longs at the 95th percentile of the past 5 years. Extremes are often contrarian setups: when everyone is on one side, the next move tends to go the other way.
04Should I trade based on the COT alone?
+−
No. The COT is a positioning lens, not a complete trading system. Use it alongside price action, technical setups and macro context — for example, treating an extreme Non-Commercial net long as a warning to tighten risk on existing longs rather than as a standalone short signal.
05How long does it take to learn to read the COT report?
+−
About one trading week of focused reading per CFTC report family you care about. For Legacy (Non-Commercial / Commercial / Non-Reportable) the foundational concepts take an hour; building intuition for what extremes look like across markets takes ~4-8 weeks of watching the Friday release alongside price action. Disaggregated, TFF, and Supplemental add detail you absorb incrementally once Legacy is solid.
06Which trader categories matter most?
+−
Depends on the market. Commodity futures (grains, metals, energies, softs): Producer/Merchant + Managed Money in the Disaggregated report — Producer/Merchant flags hedging pressure, Managed Money flags speculative crowding. Financial futures (rates, indices, FX): Asset Manager + Leveraged Funds in the TFF report. Legacy Non-Commercial / Commercial works as a fallback when you want a simpler 3-bucket view and consistency back to 1986.
07How often is the COT report released?
+−
Once a week. The CFTC publishes Friday at 15:30 ET for the Tuesday market-close snapshot — so the report you read Friday afternoon reflects positions held three trading days earlier. When a US federal holiday falls on the Wednesday, Thursday or Friday of that week, the release moves to the next business day, usually the following Monday — a Monday holiday such as Labor Day does not delay it; cot-reports.com’s auto-watcher detects the new publish in either case.
08Where can I read the COT report for free?
+−
On COT-Reports.com. The Weekly Summary, Simplified and Detailed reports and the COT Data Charts are free for every market and update every Friday after the CFTC release at 3:30 PM ET. Without an account you see the last 6 months; a free account unlocks up to 10 years of Simplified and Detailed history. COT-Reports Premium adds the full 20+ year history, custom date ranges, the Close Price column and CSV export.