
13874+ — S&P 500 CONSOLIDATED
COT Volume Profile
1 MonthVolume-weighted daily distribution
Did you know?
The CFTC has published the COT report continuously since 1962 — weekly on Fridays since 2000.
Fetching weekly net positions…

Volume-weighted price-level distribution · daily prices × weekly CFTC positioning
A premium tool that shows exactly at which price levels each trader category accumulated or distributed positions over the past 1 month / 3 months / 6 months / 1 year. Combines weekly CFTC Commitments of Traders data with daily price + volume to bucket the flow.
The COT Volume Profile combines weekly CFTC positioning changes with daily price + volume data, then buckets the per-category accumulated net change at each price level. Positive bars (right of zero) mean a category was a net buyer at that price; negative bars (left of zero) mean they were a net seller. Updated every Friday at 3:30 PM ET alongside the underlying CFTC release.
This report format is available exclusively for COT Premium subscribers.
Price column unlocked on every COT report table
For each price level the chart visited during the selected window, it shows how many contracts each CFTC trader category accumulated (right of zero) or distributed (left of zero). It answers: 'At what prices were Managed Money net buyers? Where were Commercials selling?' — a question a normal COT line chart cannot answer.
Each week we compute Δ net position per category from the CFTC report. We then allocate that Δ across the trading days in the same week, weighted by each day's volume. So a day with twice the volume of its peers absorbs twice the share of the weekly change. The day's allocated change is then bucketed by the day's closing price.
Volume Profile requires daily OHLCV (open / high / low / close / volume) data, which we pull from Yahoo Finance for the most-liquid futures markets. Niche CFTC contracts (regional electricity hubs, freight contracts, exotic forwards) don't have a tradable Yahoo symbol, so the page shows 'not available' rather than fabricating numbers.
The CFTC weekly snapshot updates every Friday at 3:30 PM ET. Daily prices roll forward intra-week — so on Wednesday, the chart includes Monday and Tuesday's allocations using the most recent CFTC report as the latest weekly anchor.
It's a context indicator, not a stand-alone entry. Volume Profile shows where flow was concentrated — strong buying at a level often becomes support; strong selling becomes resistance. But always pair it with price action confirmation, and remember that CFTC data lags by 3 trading days.
More COT Report Formats
Go beyond the free Legacy reports: the Disaggregated, TFF and Supplemental formats, custom date ranges back to 1986, the Positioning Heatmap, Advanced Charts and CSV export.
REPORTS & HISTORY
DATA & TOOLS
The 3-month and 1-year plans include the How to Read the Simplified COT Report guide free.
 Any Prop Firm.
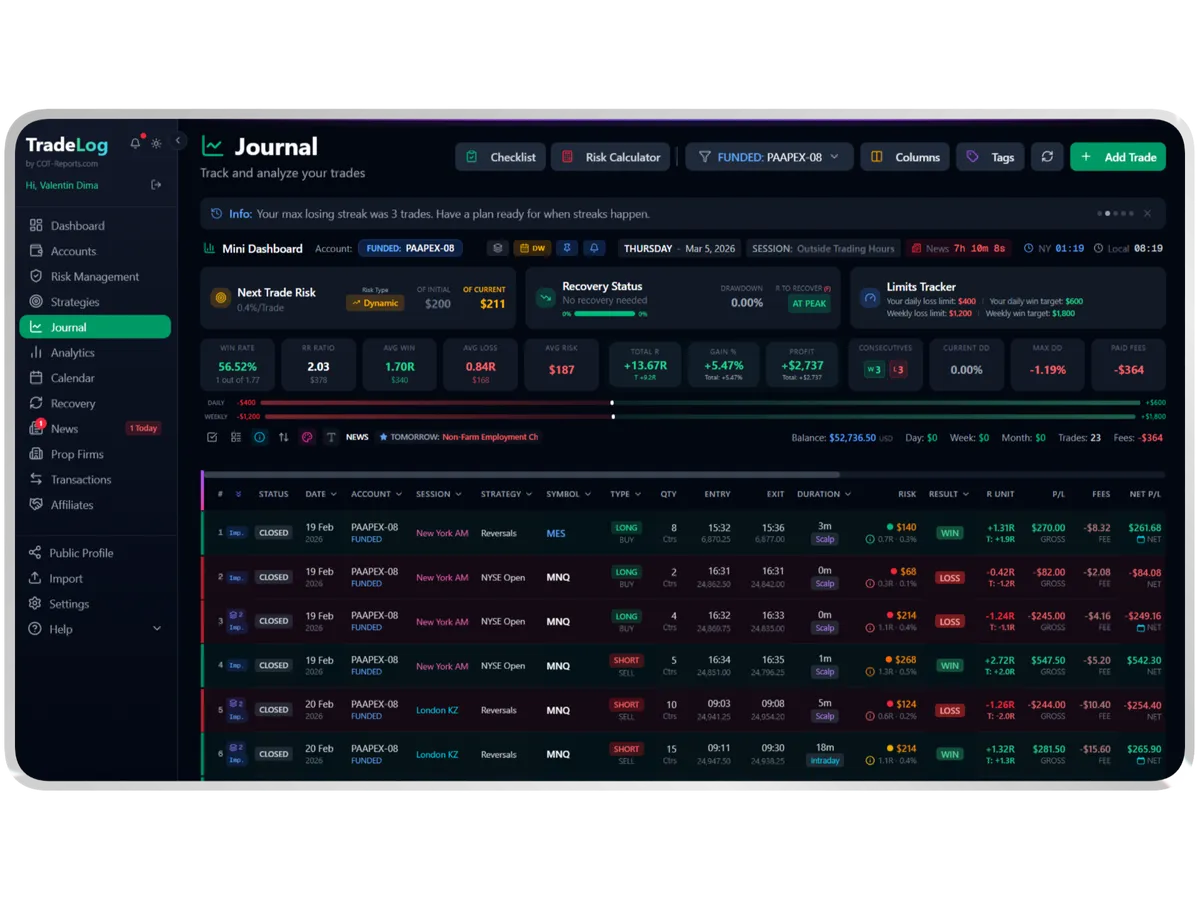
Auto-sync trades from MetaTrader, NinjaTrader, cTrader, Tradovate and more. Built-in analytics, prop-firm tracking, risk management and multi-account support. Basic and Premium include free EAs, a free cBot and a free NT Add-On.










COT-Reports Marketplace
Probably the best trading tools, made by traders for the COT-Reports community. Buy what you need, or list what you built.
 COT-Reports.com
The COT Report Simplified for each market in the map, plus the Weekly Summary, minutes after the CFTC publishes. Between Fridays, the bot sends any of them on request and keeps a free trading journal.