

Advanced COT Charts
Six decision-grade views · updated every Friday · 3:30 PM ET
The deepest analytical layer COT-Reports offers — six purpose-built views that turn the weekly CFTC release into readings, regimes and rankings. Spot the most-crowded long across all tracked markets, find the strongest cross-market correlations, see where price and positioning disagree, overlay this year against the long-run seasonal band — all from one premium dashboard.
Premium Report
This report format is available exclusively for COT Premium subscribers.
- 9 premium report formats
- Heatmap
- Advanced Charts
- CSV export
- Price column
- 20+ years of data (since 2006, Legacy since 1986)
- Futures Only & Futures & Options Combined on every report and chart
Price column unlocked on every COT report table
Advanced Charts bundles six decision-grade views for CFTC positioning: the Multi-Horizon Matrix ranks one market across four timeframes, the Crowding Dashboard compares all tracked markets in a single league table, the Correlation Explorer maps cross-market coordination, the Divergence Engine auto-flags points where price and positioning disagree, the Seasonality Overlay puts this year's positioning against its long-run seasonal band, and the Momentum panel tracks MACD-style weekly net-position flow.
- Source: U.S. Commodity Futures Trading Commission (CFTC)
- Release schedule: Every Friday, 3:30 PM ET (delayed on US federal holidays)
- What's inside: Matrix · Crowding · Correlation · Divergence · Seasonality · Momentum
- Trader categories: Non-Commercial · Commercial · Managed Money · Leveraged
Advanced Charts — Common Questions
What do I get with Advanced Charts?
Four decision-grade views built on the same CFTC Commitments of Traders data our free reports use, computed at lookbacks and across cross-sections retail tools don't cover: multi-horizon percentile matrix per market, speculator crowding league table, 36×36 correlation heatmap, and auto-flagged price-positioning divergences.
How often are Advanced Charts updated?
Every Friday around 3:30 PM ET, right after the CFTC publishes the weekly Commitments of Traders report. The correlation heatmap is server-computed once per release and cached; everything else refreshes on-demand from the same Supabase snapshot our free reports read.
Can I try Advanced Charts before subscribing?
The /cot-index page is a free single-timeframe version of the Matrix view — use it as a preview of the visual style and the underlying math. Advanced Charts is where the grid + cross-market + divergence layers unlock.
More COT Report Formats
Unlock Every COT Report Format.
Every COT Report with Advanced Analytics
Go beyond the free Legacy reports: the Disaggregated, TFF and Supplemental formats, custom date ranges back to 1986, the Positioning Heatmap, Advanced Charts and CSV export.
REPORTS & HISTORY
- ✓Disaggregated — Managed Money & Swap Dealers
- ✓Traders in Financial Futures (TFF) — Leveraged Funds & Asset Managers
- ✓Supplemental — Commodity Index Traders
- ✓Simplified, Detailed & Latest views of all three
- ✓Custom date ranges, back to 1986
- ✓Both CFTC variants of every report, one click apart
DATA & TOOLS
- ✓Close Price column & CSV export
- ✓Every trader group's figures on the Positioning Heatmap
- ✓Advanced Charts & COT Volume Profile
- ✓Custom Weekly Summary & My Markets
- ✓Table screenshots (PNG) with no daily limit
- ✓The complete How to Read the Simplified COT Report guide (3-month and annual plans)
The 3-month and 1-year plans include the How to Read the Simplified COT Report guide free.


 Any Prop Firm.
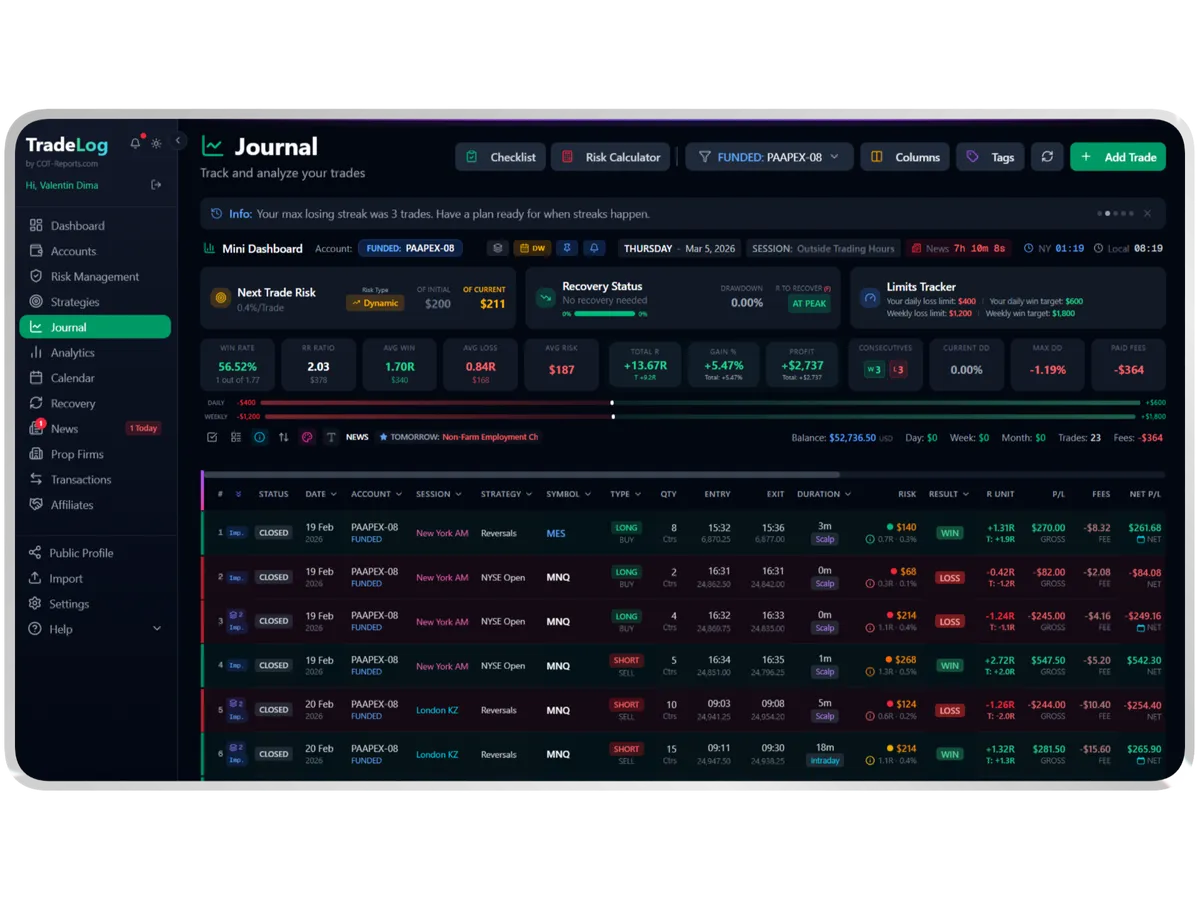
Automated Trading Journal
Auto-sync trades from MetaTrader, NinjaTrader, cTrader, Tradovate and more. Built-in analytics, prop-firm tracking, risk management and multi-account support. Basic and Premium include free EAs, a free cBot and a free NT Add-On.










COT-Reports Marketplace
Traders build it. Traders use it.
Probably the best trading tools, made by traders for the COT-Reports community. Buy what you need, or list what you built.
 COT-Reports.com
Every Friday, 35 markets land in Telegram. FREE.
The COT Report Simplified for each market in the map, plus the Weekly Summary, minutes after the CFTC publishes. Between Fridays, the bot sends any of them on request and keeps a free trading journal.