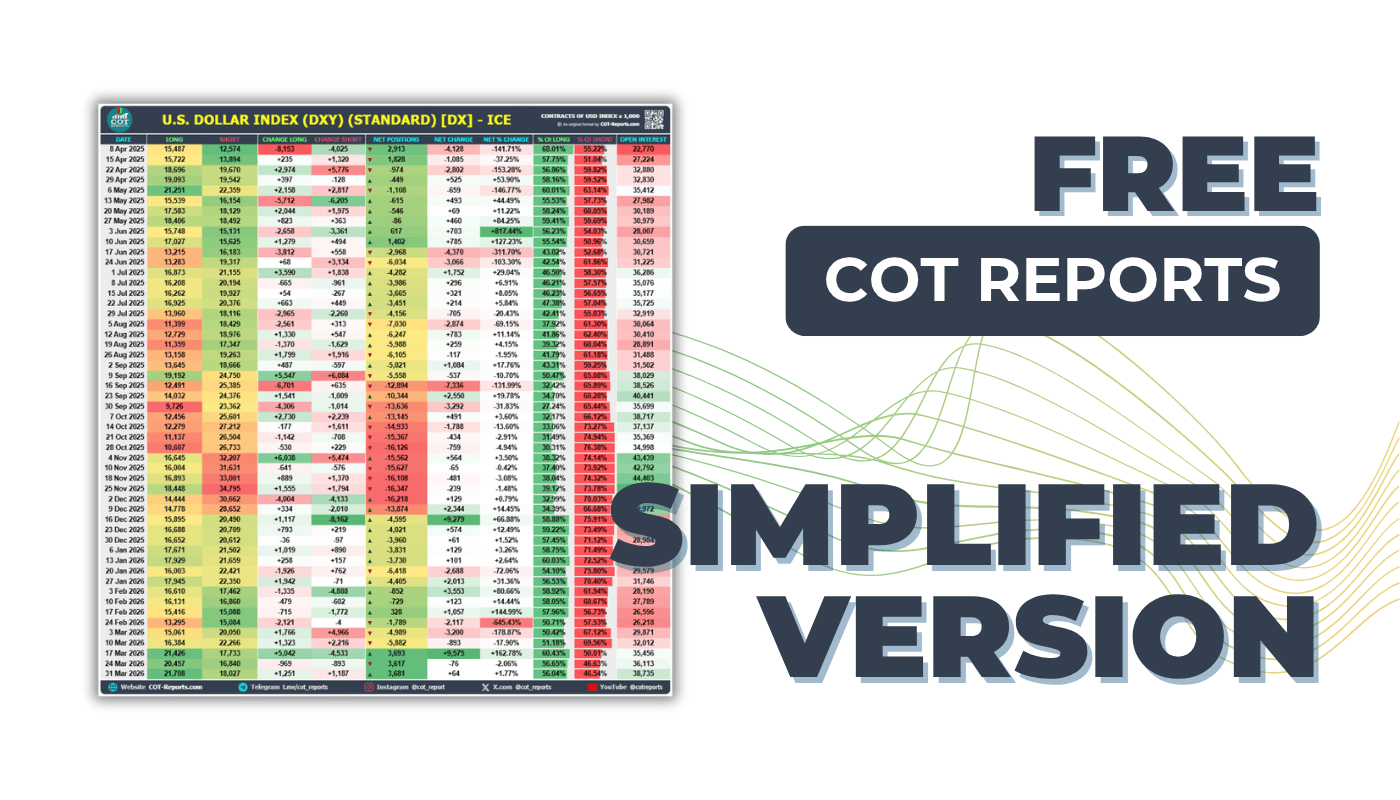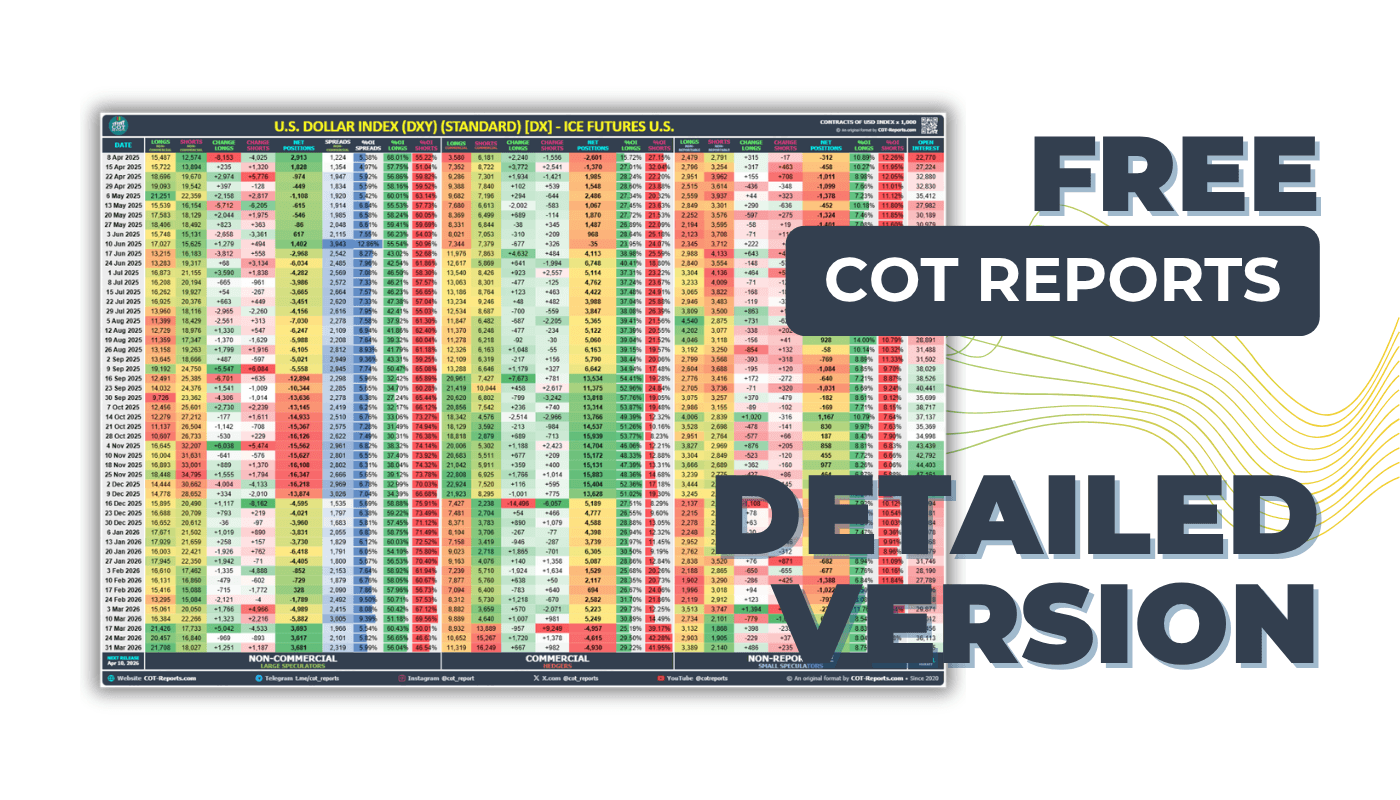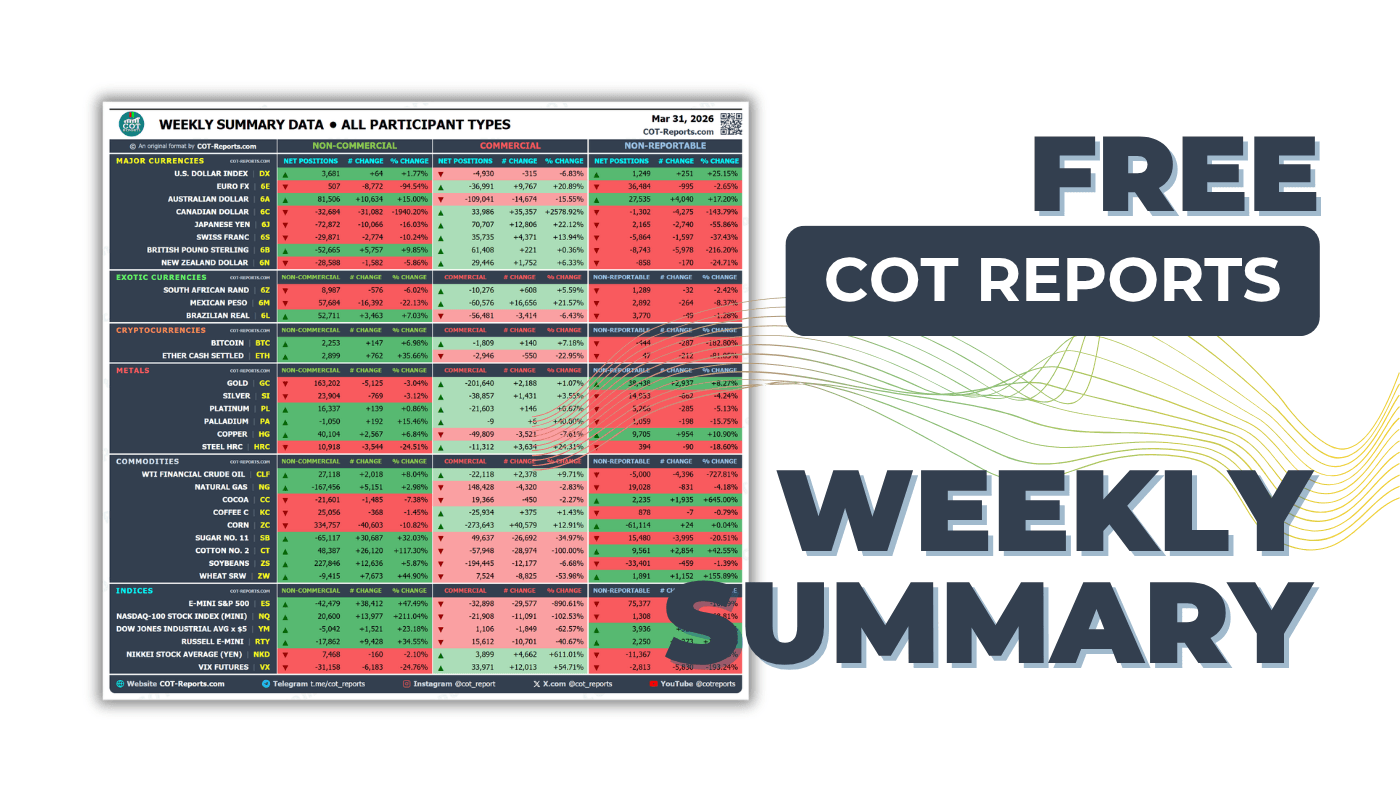
What is the COT Index?
The COT Index normalizes the net position of a trader category to a 0-100 scale, where 0 means the most short the group has been over the chosen lookback and 100 means the most long. It collapses 'how extreme is positioning right now?' into a single number you can read at a glance.
Definition
The COT Index, sometimes called the Briese Index after analyst Steve Briese who popularized it, takes the net position (long minus short contracts) of a trader category in the weekly CFTC report, as a percentage of open interest, and rescales it onto a 0-100 axis using the highest and lowest readings of the chosen lookback window. A 100 means the group is at its most long over that window; a 0 means its most short. Anywhere between shows where the net position sits inside that range.
The Formula
The math is a min–max normalization. For each weekly observation, you measure how far the current net is from the minimum net of the last N weeks, then divide by the full range. Multiplied by 100, you get a value bounded by 0 and 100 inclusive. Window N is the only knob — different lookbacks answer different questions about whether today's positioning is unusual.
COT Index = 100 × (Current Net − Min Net over N) / (Max Net over N − Min Net over N)

where  Net = (Long − Short) / Open Interest × 100  for the selected trader category
       N   ∈ { 26, 52, 156, 260 }  weeks
How to read the COT Index
The two regions COT readers watch most are the tails. Readings above 80 are typically called extreme long — the trader group is more long than they've been almost any week of the lookback. Below 20 is extreme short. Commercials are hedgers: they tend to sell as prices rise and buy as prices fall, so their net position usually runs against the price trend. When speculators (Non-Commercial) are extreme in the same direction as price, COT readers call the trade crowded. The middle band (20-80) is normal positioning. Many traders also set the index next to price: a new price high while the Non-Commercial COT Index makes a lower high is called a divergence.
Example interpretations
Suppose Gold's commercial COT Index over a 52-week lookback hits 95 — commercials have built one of their most-long positions of the past year. COT readers watch for this, because commercials, as hedgers, usually add longs as prices fall. Conversely, if the Non-Commercial COT Index for Gold also hits 95 (large speculators piling in long while commercials sell), COT readers call the trade crowded. The split between commercial and speculator extremes is what the index makes visible — it's not just 'who's long,' it's 'who's at an extreme relative to their own recent history.'
Limitations
The COT Index is descriptive, not predictive. An extreme can persist for months — markets can stay irrational longer than positions can pivot. The index also depends entirely on the chosen lookback: a 26-week extreme says nothing about a 156-week regime, so cross-checking multiple windows is good hygiene. Finally, the weekly publication lag (Tuesday positions, Friday release) means the readings are always a few days old. Use the COT Index for context, not as a standalone trading rule.
COT Index, COT charts and market pages
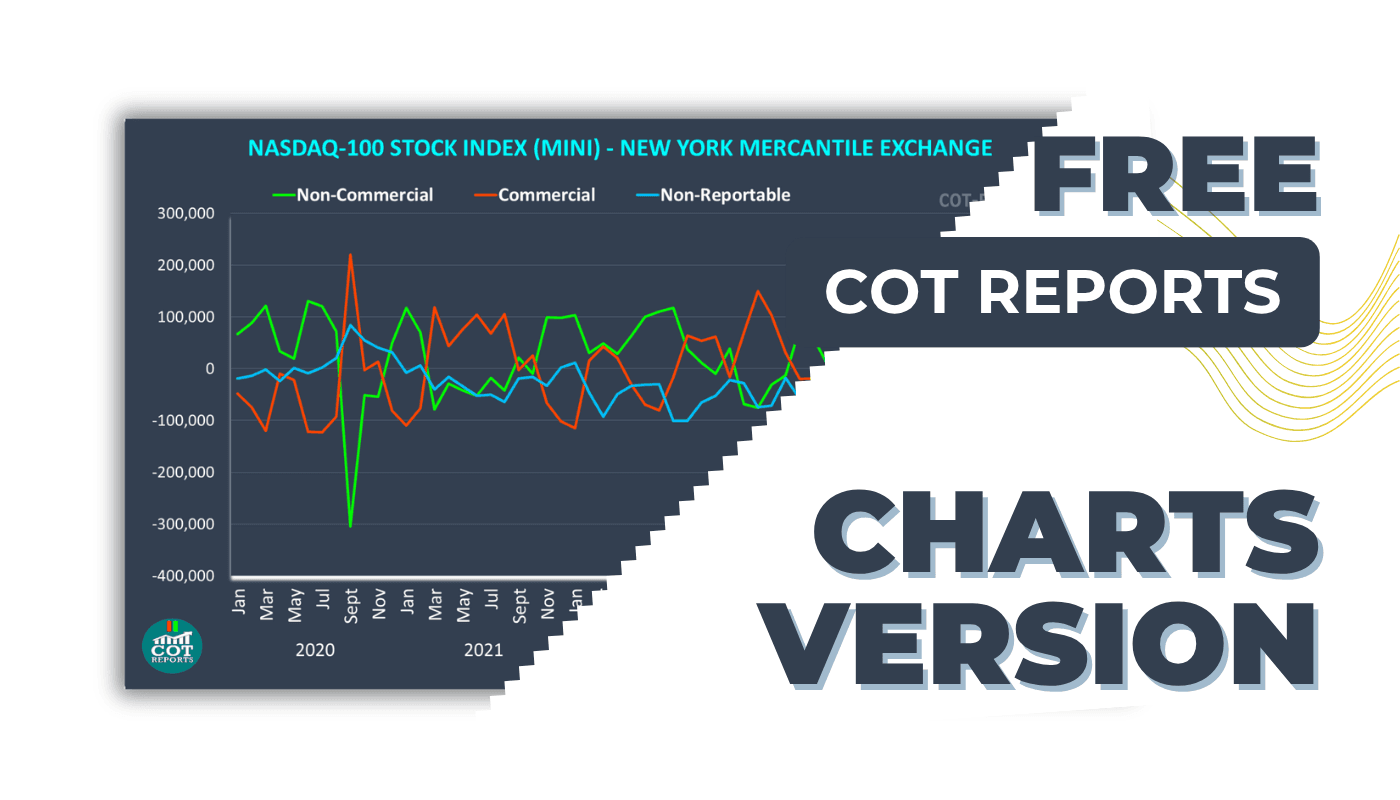
The COT Index is built from the same weekly net positions and open interest that the COT charts plot in contracts, next to price: open them to see the raw numbers behind an index reading. For one market's full positioning picture, see the Gold COT report and the Euro FX COT report.