Per-trader breakdown · CFTC weekly release · 3:30 PM ET
The full Legacy Commitments of Traders report broken out trader-by-trader: every category split into Long, Short, Spreading and weekly Change. Spot positioning shifts and net flow at the fastest possible glance. Updated every Friday at 3:30 PM ET, sourced directly from the U.S. Commodity Futures Trading Commission.
The latest CFTC Commitments of Traders (COT) report (Legacy) was released on Friday, 30 October 2026, reflecting futures positions as of the close of trading on Tuesday, 27 October 2026.
Configure your COT Report analysis parameters below
Currently showing:GOLD - COMMODITY EXCHANGE INC. | 26 reports | 5 May 2026 to 27 Oct 2026 · Variant: Futures Only
Share:
Premium also unlocks the Price column — daily settlement prices alongside positioning — plus CSV export and 20+ years of historical data, on every market and every report family.
* COT data sourced from the U.S. Commodity Futures Trading Commission (CFTC). Positions are captured as of Tuesday close and published the following Friday at 3:30 PM ET. Close Price reflects the settlement price on the report date, sourced from Yahoo Finance. Where no price is available (market holiday or unlisted instrument), the field shows "—". This data is provided for informational purposes only and does not constitute financial advice.
Did you know?
The CFTC has published the COT report continuously since 1962 — weekly on Fridays since 2000.
Preparing table…
About the Detailed COT Report
The Detailed COT Report shows all three CFTC trader categories — Non-Commercial (large speculators), Commercial (hedgers) and Non-Reportable (small traders) — for every futures market in a single weekly table with long, short, net positions and percentage of open interest, released every Friday at 3:30 PM Eastern Time.
Source: U.S. Commodity Futures Trading Commission (CFTC)
Release schedule: Every Friday, 3:30 PM ET (delayed on US federal holidays)
The Commitment of Traders (COT) Reports Detailed Version provide an in-depth view of trader positioning across all major futures markets. By default this table is built using Futures Only COT data (COT Premium members can switch to Futures & Options Combined), sourced directly from the U.S. Commodity Futures Trading Commission (CFTC), and breaks down positions by Non-Commercial (Large Speculators), Commercial (Hedgers), and Non-Reportable (Small Traders). By displaying long, short, and spreading positions along with weekly changes, net positions, percentage of open interest, and total open interest, this detailed COT analysis helps traders understand the full market structure. Historical COT data is available for 20+ years, allowing you to track institutional positioning shifts and identify long-term accumulation or distribution patterns. Data is published every Friday at 3:30 PM ET for positions as of Tuesday. Use this comprehensive report as part of your trading strategy to gain deeper insights into market dynamics.
The Detailed COT Report is the full Legacy Commitments of Traders table, shown as Futures Only by default (COT Premium members can switch to Futures & Options Combined). For every CFTC market it shows long, short, net positions, and the percentage of open interest held by each of the three trader categories: Non-Commercial (large speculators), Commercial (hedgers) and Non-Reportable (small traders).
02
Who are Commercials in the COT report?
+−
Commercials are entities that use the futures market primarily to hedge an underlying business risk — e.g. a corn farmer selling futures to lock in next harvest's price, or an airline buying crude oil futures to fix fuel cost. Their net position is usually opposite to Non-Commercials; an extreme reading means it sits at the edge of its own historical range.
03
What does Open Interest mean?
+−
Open Interest is the total number of futures contracts that have been opened and not yet closed, expired or delivered. It measures market participation. Rising open interest with a rising price means new positions are being opened as the price climbs; falling open interest with a rising price means positions are being closed — for example short-covering — rather than new ones opened.
04
How do I interpret Non-Reportables?
+−
Non-Reportables are traders whose position size is below the CFTC reporting threshold — effectively retail and small institutional traders. Many traders watch Non-Reportable net positioning as a sentiment gauge: it shows how heavily small traders lean long or short compared with their own history.
05
Is the Detailed COT Report free?
+−
Yes. The Detailed COT Report and 6 months of historical data are free with no signup. Free accounts unlock 1-year through 10-year historical periods. Premium accounts unlock all CFTC report formats (Disaggregated, TFF, Supplemental), 20+ years of data, CSV export and every trader group’s figures on the Positioning Heatmap.
06
How are weekly reports aggregated when I group them?
+−
When you switch the Group Reports filter from Individual to Bi-Weekly, Monthly, Quarterly, Half-Year or Yearly, the underlying weekly CFTC reports are combined as follows. Snapshot columns (Long, Short, Spreading, Open Interest) are averaged across the period — a monthly row shows the average position across the 4-5 weeks that fall inside that month. Flow columns (Change Long, Change Short, Change OI) are summed, because they represent weekly deltas and the period total is the cumulative flow. NET % CHANGE uses an endpoint formula: it compares the net position in the last week of the period to the net position in the first week, expressed as a percentage. The small ×N chip on the DATE cell shows exactly how many weekly reports were aggregated into that row.
Explore All Report Formats
Simplified
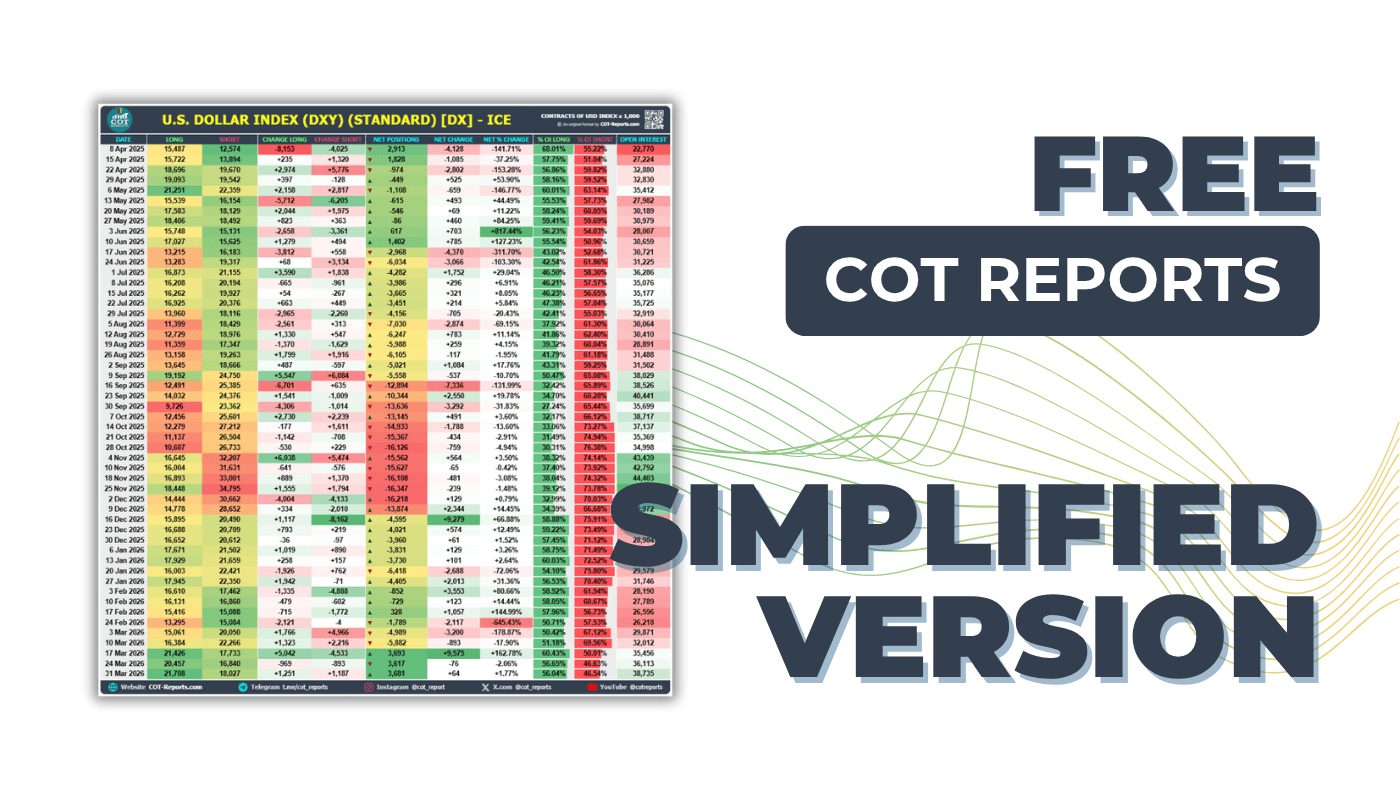
Weekly data per market (6 months without an account, up to 10 years with a free one) with Non-Commercial, Commercial, and Non-Reportable positions.
Unlock Every COT Report Format. Every COT Report with Advanced Analytics
Go beyond the free Legacy reports: the Disaggregated, TFF and Supplemental formats, custom date ranges back to 1986, every trader group on the Positioning Heatmap, Advanced Charts and CSV export.
✓Both CFTC variants of every report, one click apart
DATA & TOOLS
✓Close Price column & CSV export
✓Every trader group's figures on the Positioning Heatmap
✓Advanced Charts & COT Volume Profile
✓Custom Weekly Summary & My Watchlist
✓Table screenshots (PNG) with no daily limit
✓The complete How to Read the Simplified COT Report guide (3-month and annual plans)
Go PremiumPRO$14/mo · $39/3 mo · $119/y · Cancel any time
The 3-month and 1-year plans include the How to Read the Simplified COT Report guide free.
Disaggregated
4 Trader Types
TFF
Financial Futures
Supplemental
Index Traders
Price
Price + COT Data
More from COT-Reports
TradeLog·Any Broker.Any Broker. Any Prop Firm. Any Market.
Automated Trading Journal
Auto-sync trades from MetaTrader, NinjaTrader, cTrader, Tradovate and more. Built-in analytics, prop-firm tracking, risk management and multi-account support. Basic and Premium include free EAs, a free cBot and a free NT Add-On.
From $9/mo · auto-sync from $19/mo · 14-day free trial
The COT Report Simplified for each market in the map, plus the Weekly Summary, minutes after the CFTC publishes. Between Fridays, the bot sends any of them on request and keeps a free trading journal.