
What the COT Reports Are
The Commitments of Traders (COT) reports are published by the U.S. Commodity Futures Trading Commission (CFTC) to help the public understand how futures markets are positioned. They break down the open interest in a market by type of trader — so you can see who is long, who is short, and which way the big players are leaning.
This guide teaches you to read them the way they appear on COT-Reports.com: where the data comes from, what every column means, how the colors work, and how to line a report up against a price chart to confirm what you’re seeing.
By looking at the net positions of each group, you get a read on market sentiment — whether a category of trader is, on balance, bullish or bearish on the market.
Read it for the speculators
Where the Data Comes From
The CFTC is an independent U.S. government agency, established in 1974, that regulates the futures and options markets (the CME, ICE and others). The COT data is collected through its large-trader reporting system.
Reporting firms — futures commission merchants (FCMs), clearing members, foreign brokers and the exchanges — file position data with the CFTC, but only for traders at or above the CFTC’s reportable levels. The CFTC compiles those filings and publishes the result.
How the weekly cycle works
Positions are snapshotted on Tuesday, and the report is released the following Friday at 3:30 PM Eastern Time. Firms file daily; the CFTC compiles, verifies and publishes weekly. So every Friday you get a clean Tuesday-to-Tuesday view of how positioning changed over the week.
The reports cover a wide range of markets — currencies, indices, metals, energies and agricultural products — with the number of open contracts and the long/short breakdown for each category of trader.
From the raw CFTC file to a report you can read
Everything in this guide starts from one file the CFTC releases every week — the official Commitments of Traders reports, published free on the government’s own site, cftc.gov. On its own, that file looks like this — a real Legacy (Futures-Only) report for Wheat:
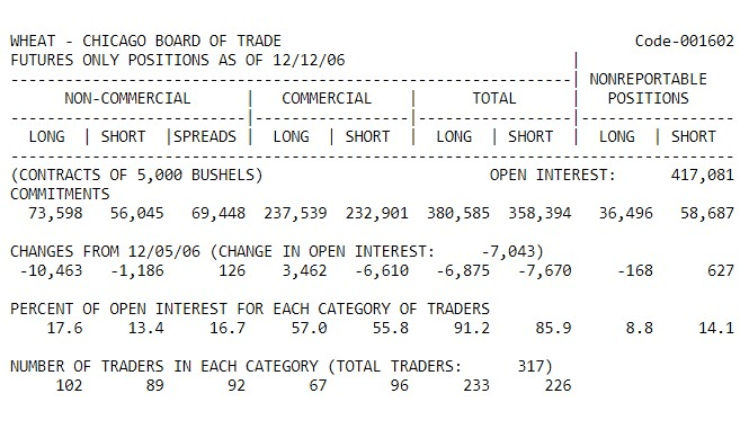
It’s all there — but it’s a wall of numbers. No colour, no net position worked out for you, no sense of where this week sits in the trend, and you’d open a separate file for every past week. COT-Reports takes that exact data and turns it into this — the very same market, today:

![]() CONTRACTS OF 5,000 bushels ©An original format byCOT-Reports.com WHEAT (CHICAGO) - CBOT | ||||||||||
| DATE | LONG | SHORT | CHANGE LONG | CHANGE SHORT | NET POSITIONS | NET CHANGE | NET % CHANGE | % OI LONG | % OI SHORT | OPEN INTEREST |
|---|---|---|---|---|---|---|---|---|---|---|
| 31 Mar 2026 | 145,000 | 154,415 | +7,772 | +99 | ▲-9,415 | +7,673 | +81.50% | 29.68% | 31.60% | 488,618 |
| 7 Apr 2026 | 138,222 | 156,929 | -6,778 | +2,514 | ▼-18,707 | -9,292 | -98.69% | 27.51% | 31.23% | 502,479 |
| 14 Apr 2026 | 128,989 | 147,355 | -9,233 | -9,574 | ▲-18,366 | +341 | +1.82% | 27.71% | 31.65% | 465,537 |
| 21 Apr 2026 | 121,024 | 146,561 | -7,965 | -794 | ▼-25,537 | -7,171 | -39.04% | 26.77% | 32.42% | 452,052 |
| 28 Apr 2026 | 132,336 | 131,470 | +11,312 | -15,091 | ▲866 | +26,403 | +103.39% | 31.24% | 31.04% | 423,571 |
| 5 May 2026 | 128,830 | 145,498 | -3,506 | +14,028 | ▼-16,668 | -17,534 | -2024.71% | 29.70% | 33.54% | 433,831 |
| 12 May 2026 | 134,577 | 148,998 | +5,747 | +3,500 | ▲-14,421 | +2,247 | +13.48% | 30.12% | 33.35% | 446,762 |
| 19 May 2026 | 143,267 | 143,004 | +8,690 | -5,994 | ▲263 | +14,684 | +101.82% | 30.19% | 30.13% | 474,622 |
| 26 May 2026 | 144,186 | 153,644 | +919 | +10,640 | ▼-9,458 | -9,721 | -3696.20% | 29.69% | 31.63% | 485,691 |
| 2 Jun 2026 | 124,550 | 165,312 | -19,636 | +11,668 | ▼-40,762 | -31,304 | -330.98% | 25.82% | 34.27% | 482,332 |
| 9 Jun 2026 | 115,711 | 173,564 | -8,839 | +8,252 | ▼-57,853 | -17,091 | -41.93% | 25.47% | 38.20% | 454,377 |
| 16 Jun 2026 | 116,522 | 167,334 | +811 | -6,230 | ▲-50,812 | +7,041 | +12.17% | 26.21% | 37.63% | 444,641 |
| 23 Jun 2026 | 117,821 | 166,232 | +1,299 | -1,102 | ▲-48,411 | +2,401 | +4.73% | 27.51% | 38.81% | 428,305 |
| 30 Jun 2026 | 109,433 | 164,437 | -8,388 | -1,795 | ▼-55,004 | -6,593 | -13.62% | 26.91% | 40.43% | 406,723 |
| 7 Jul 2026 | 111,128 | 160,858 | +1,695 | -3,579 | ▲-49,730 | +5,274 | +9.59% | 26.94% | 38.99% | 412,570 |
| 14 Jul 2026 | 117,880 | 134,219 | +6,752 | -26,639 | ▲-16,339 | +33,391 | +67.14% | 27.46% | 31.26% | 429,298 |
| 21 Jul 2026 | 109,575 | 116,584 | -8,305 | -17,635 | ▲-7,009 | +9,330 | +57.10% | 24.06% | 25.60% | 455,433 |
| 28 Jul 2026 | 119,046 | 121,038 | +9,471 | +4,454 | ▲-1,992 | +5,017 | +71.58% | 25.68% | 26.11% | 463,502 |
| 4 Aug 2026 | 117,112 | 131,871 | -1,934 | +10,833 | ▼-14,759 | -12,767 | -640.91% | 25.11% | 28.28% | 466,323 |
| 11 Aug 2026 | 114,979 | 139,889 | -2,133 | +8,018 | ▼-24,910 | -10,151 | -68.78% | 24.18% | 29.42% | 475,566 |
| 18 Aug 2026 | 114,685 | 133,450 | -294 | -6,439 | ▲-18,765 | +6,145 | +24.67% | 25.09% | 29.19% | 457,148 |
| 25 Aug 2026 | 121,212 | 127,991 | +6,527 | -5,459 | ▲-6,779 | +11,986 | +63.87% | 27.33% | 28.86% | 443,531 |
| 1 Sep 2026 | 146,391 | 121,688 | +25,179 | -6,303 | ▲24,703 | +31,482 | +464.40% | 31.11% | 25.86% | 470,560 |
| 8 Sep 2026 | 131,898 | 121,428 | -14,493 | -260 | ▼10,470 | -14,233 | -57.62% | 27.21% | 25.05% | 484,680 |
| 15 Sep 2026 | 126,842 | 125,614 | -5,056 | +4,186 | ▼1,228 | -9,242 | -88.27% | 26.15% | 25.89% | 485,138 |
| 22 Sep 2026 | 120,127 | 127,487 | -6,715 | +1,873 | ▼-7,360 | -8,588 | -699.35% | 24.86% | 26.38% | 483,279 |
Same source, same numbers — a completely different read. The colour does the first pass for you, the columns the CFTC never works out are computed automatically, and a whole year sits on one screen instead of in dozens of separate files. That transformation — the colours, the computed columns, the one-click currency flip — is what the rest of this guide walks you through.
Same data, made readable
The CFTC’s COT data is U.S. government information in the public domain. COT-Reports.com is an independent service that mirrors and reformats it — we are not affiliated with, or endorsed by, the CFTC. You can cross-check any figure here against the official weekly release on cftc.gov.
Commercial vs Non-Commercial — Who They Are
Commercial traders (hedgers)
Commercial traders, also called hedgers, take part in the futures market to manage the financial risk of their actual business — producers, processors and users of a commodity (farmers, manufacturers, airlines). They use futures to lock in prices and reduce exposure to price swings, not to speculate.
Non-Commercial traders (large speculators)
Non-Commercial traders, also called speculators, are there to profit from price moves rather than to hedge a business. They include hedge funds, professional traders and other financial institutions, and can be long or short depending on their outlook.
Why non-commercials matter most
Because speculators have the size to move price, the Non-Commercial net position is the headline read for most traders: the direction of their positioning often points to where the market is leaning. That’s why the Simplified report defaults to the Non-Commercial view.
The Report, Column by Column
Here is a live Simplified report. Below it, we walk through every column — what each one means and how to read it — from DATE all the way through to the Premium Price column.
![]() CONTRACTS OF EUR 125,000 ©An original format byCOT-Reports.com EURO FX - CME | ||||||||||
| DATE | LONG | SHORT | CHANGE LONG | CHANGE SHORT | NET POSITIONS | NET CHANGE | NET % CHANGE | % OI LONG | % OI SHORT | OPEN INTEREST |
|---|---|---|---|---|---|---|---|---|---|---|
| 31 Mar 2026 | 200,168 | 199,661 | +143 | +8,915 | ▼507 | -8,772 | -1730.18% | 25.85% | 25.79% | 774,237 |
| 7 Apr 2026 | 200,946 | 208,487 | +778 | +8,826 | ▼-7,541 | -8,048 | -1587.38% | 25.93% | 26.90% | 775,043 |
| 14 Apr 2026 | 214,639 | 188,621 | +13,693 | -19,866 | ▲26,018 | +33,559 | +445.02% | 27.21% | 23.91% | 788,828 |
| 21 Apr 2026 | 217,407 | 176,083 | +2,768 | -12,538 | ▲41,324 | +15,306 | +58.83% | 27.50% | 22.27% | 790,622 |
| 28 Apr 2026 | 217,091 | 181,379 | -316 | +5,296 | ▼35,712 | -5,612 | -13.58% | 27.09% | 22.63% | 801,430 |
| 5 May 2026 | 217,474 | 185,272 | +383 | +3,893 | ▼32,202 | -3,510 | -9.83% | 26.65% | 22.71% | 815,942 |
| 12 May 2026 | 224,002 | 183,802 | +6,528 | -1,470 | ▲40,200 | +7,998 | +24.84% | 27.01% | 22.16% | 829,377 |
| 19 May 2026 | 233,251 | 199,738 | +9,249 | +15,936 | ▼33,513 | -6,687 | -16.63% | 28.24% | 24.18% | 826,019 |
| 26 May 2026 | 223,055 | 193,629 | -10,196 | -6,109 | ▼29,426 | -4,087 | -12.20% | 27.06% | 23.49% | 824,224 |
| 2 Jun 2026 | 235,442 | 186,576 | +12,387 | -7,053 | ▲48,866 | +19,440 | +66.06% | 27.95% | 22.15% | 842,424 |
| 9 Jun 2026 | 219,564 | 205,632 | -15,878 | +19,056 | ▼13,932 | -34,934 | -71.49% | 25.19% | 23.59% | 871,507 |
| 16 Jun 2026 | 228,005 | 193,652 | +8,441 | -11,980 | ▲34,353 | +20,421 | +146.58% | 25.48% | 21.65% | 894,671 |
| 23 Jun 2026 | 247,332 | 217,174 | +19,327 | +23,522 | ▼30,158 | -4,195 | -12.21% | 31.49% | 27.65% | 785,477 |
| 30 Jun 2026 | 235,658 | 234,559 | -11,674 | +17,385 | ▼1,099 | -29,059 | -96.36% | 29.83% | 29.69% | 790,076 |
| 7 Jul 2026 | 223,430 | 239,657 | -12,228 | +5,098 | ▼-16,227 | -17,326 | -1576.52% | 28.11% | 30.15% | 794,833 |
| 14 Jul 2026 | 230,307 | 242,912 | +6,877 | +3,255 | ▲-12,605 | +3,622 | +22.32% | 28.81% | 30.38% | 799,495 |
| 21 Jul 2026 | 220,465 | 261,803 | -9,842 | +18,891 | ▼-41,338 | -28,733 | -227.95% | 27.56% | 32.72% | 800,061 |
| 28 Jul 2026 | 204,975 | 277,422 | -15,490 | +15,619 | ▼-72,447 | -31,109 | -75.26% | 25.00% | 33.84% | 819,806 |
| 4 Aug 2026 | 201,847 | 259,938 | -3,128 | -17,484 | ▲-58,091 | +14,356 | +19.82% | 25.23% | 32.50% | 799,909 |
| 11 Aug 2026 | 197,186 | 257,196 | -4,661 | -2,742 | ▼-60,010 | -1,919 | -3.30% | 24.59% | 32.07% | 801,884 |
| 18 Aug 2026 | 196,241 | 255,329 | -945 | -1,867 | ▲-59,088 | +922 | +1.54% | 24.38% | 31.72% | 804,940 |
| 25 Aug 2026 | 198,919 | 235,271 | +2,678 | -20,058 | ▲-36,352 | +22,736 | +38.48% | 24.30% | 28.74% | 818,524 |
| 1 Sep 2026 | 203,477 | 228,402 | +4,558 | -6,869 | ▲-24,925 | +11,427 | +31.43% | 23.51% | 26.39% | 865,412 |
| 8 Sep 2026 | 198,509 | 241,125 | -4,968 | +12,723 | ▼-42,616 | -17,691 | -70.98% | 21.06% | 25.58% | 942,464 |
| 15 Sep 2026 | 209,000 | 235,993 | +10,491 | -5,132 | ▲-26,993 | +15,623 | +36.66% | 22.72% | 25.65% | 920,035 |
| 22 Sep 2026 | 220,708 | 273,042 | +11,708 | +37,049 | ▼-52,334 | -25,341 | -93.88% | 26.86% | 33.23% | 821,689 |
DATE
The Tuesday the data was snapshotted — the close of the reporting week. (Released the following Friday at 3:30 PM ET.)
LONG & SHORT
LONG is the number of outstanding buy contracts held by the selected category; SHORT is the number of sell contracts. A high long count from speculators leans bullish; a high short count leans bearish.
These are a count of contracts — not a fixed quantity
CHANGE LONG & CHANGE SHORT
The week-over-week change in long and short positions — how many contracts were opened or closed since the previous report. Each is simply this week’s figure minus last week’s.
NET POSITIONS
The headline number: Long − Short for the selected category. Positive = more longs than shorts (net bullish); negative = more shorts than longs (net bearish). A net of +10,000 means 10,000 more long contracts than short; −10,000 is the reverse. This is usually the first column traders look at.
NET CHANGE
How much the Net Positions figure moved since last report. It equals Change Long − Change Short — the same as this week’s Net minus last week’s. Positive (green) = the category got more net-long (more bullish); negative (red) = more net-short. The ▲/▼ arrow in the Net cell points the same way. On grouped views it’s measured between the first and last report of the period.
NET % CHANGE
The Net Change expressed as a percentage of the previous week’s net — it puts the move in proportion. The formula:
Net % Change = (Net Change ÷ |previous week’s Net|) × 100
- The denominator uses the absolute value of last week’s net, so the sign reflects the direction of the move, not the sign of the base figure.
- If last week’s net was exactly zero, it shows 0.00% (no dividing by zero).
- Shown to two decimals with a leading sign; grouped views use the period’s endpoints.
A +20% swing is far more meaningful than a raw contract number can tell you — it shows how big the shift is relative to where the position already stood.
% OI LONG & % OI SHORT
The category’s long (or short) positions as a percentage of total open interest — category longs ÷ total OI. This tells you how big this group’s footprint is relative to everyone trading the market, not just relative to itself.
OPEN INTEREST
The total number of outstanding contracts in the market — summed across all categories (commercial + non-commercial + non-reportable), each contract counted once.
Open Interest is the whole market — not one category
PRICE (Premium)
The market’s settlement (closing) price on the report’s Tuesday date — shown next to the positioning so you can line up what traders did against what price did, in the same row. It’s end-of-day settlement data (not live or intraday), shaded on the same scale as the other columns; decimals adapt to the instrument. A Premium feature — free visitors see it locked behind a PRO badge.
The Detailed report shows more
Why read it here, not in the raw CFTC file
The CFTC publishes the same data as a plain spreadsheet of numbers. This Simplified table is that data, made readable — it’s what the table above gives you over a raw download:
- Color heat-mapping turns a wall of six-digit figures into an instant read (the whole of Part II).
- A full year (or more) on one screen — scroll a single market’s history without juggling weekly files.
- Columns the CFTC file doesn’t contain, computed for you: Net Positions, Net Change, Net % Change, and the ▲/▼ direction arrow.
- The Price column lines settlement price up against positioning in the same row (Premium).
- One-click 180° View to read currency reports from the dollar-pair side, and Group Reports to aggregate the weeks (both covered in Part II).
- Switchable trader category and time period, and a clean shareable image — the table carries the site and social footer, ready to screenshot and post.
Reading the Reports When You Trade
The single most important habit with currencies: every currency in the reports is quoted against the U.S. dollar — as that currency over USD. The Canadian dollar report is CAD/USD, not USD/CAD; the Swiss Franc report is CHF/USD, not USD/CHF.
The 180-degree flip
So the perspective flips 180° versus how most pairs are quoted on your chart. Take USD/JPY: the Japanese Yen report shows JPY/USD.
If you plan to go short USD/JPY, you want to see rising long positions in the Japanese Yen report (long JPY/USD = a stronger yen = a falling USD/JPY).
Once you internalize that the report is the inverse of the dollar-quoted pair, everything clicks.
And you don’t have to keep doing that flip in your head. COT-Reports.com puts a 180° View button on every report that inverts the color reading for you: the numbers stay in their native form (JPY/USD), but green and red swap so the colors reflect the pair you actually trade (USD/JPY). Turn it on for the Yen report and a strengthening dollar lights up the way you’d expect on a USD/JPY chart — no mental gymnastics.
The 180° View button
Trading non-USD pairs
When neither leg is the dollar, weigh both currencies’ reports. To go long GBP/CAD you’d want a strong GBP report (net long) and a weak CAD report (net short). You can read two markets together on the Comparison page.
Open the Comparison page — read two markets side by sideThe U.S. Dollar Index
The U.S. Dollar Index (DXY) measures the dollar against a basket of major currencies, built from six pairs: EUR/USD · USD/JPY · GBP/USD · USD/CAD · USD/SEK · USD/CHF. The weights are fixed (the standard ICE weights, unchanged since the euro launched in 1999):
| Currency | Weight |
|---|---|
| Euro (EUR) | 57.6% |
| Japanese yen (JPY) | 13.6% |
| British pound (GBP) | 11.9% |
| Canadian dollar (CAD) | 9.1% |
| Swedish krona (SEK) | 4.2% |
| Swiss franc (CHF) | 3.6% |
The euro is by far the largest component — almost 58% — so the index moves largely with EUR/USD.
Use it as confirmation
What You’ve Learned So Far
A quick recap of Part I:
- Where the data comes from — the CFTC’s large-trader reporting system.
- How it’s provided — firms file daily; the CFTC publishes weekly (Tuesday snapshot, Friday 3:30 PM ET).
- Who the traders are — hedgers protecting a business vs. speculators betting on price.
- Every column — including Net Change, Net % Change and the Premium Price column.
- Reading currencies — the 180° flip (report = currency/USD), and weighing both legs of a cross.
- The Dollar Index — composition, weights, and its role as a confirmation tool.
You can now open any market on COT-Reports.com and read a row of data with confidence. Next: Part II — Understanding the Colors, where the red-yellow-green scale turns these numbers into an instant read on sentiment.
Why the Reports Are Colored, and How the Scale Works
Raw numbers are slow to read. So every COT table on this site is colored like a heat map — the shading does the first pass of the analysis for you: it shows the highs and lows of a column instantly, highlights change, and makes a full year (or ten) readable on one screen.
![]() CONTRACTS OF CHF 125,000 ©An original format byCOT-Reports.com SWISS FRANC - CME | ||||||||||
| DATE | LONG | SHORT | CHANGE LONG | CHANGE SHORT | NET POSITIONS | NET CHANGE | NET % CHANGE | % OI LONG | % OI SHORT | OPEN INTEREST |
|---|---|---|---|---|---|---|---|---|---|---|
| 31 Mar 2026 | 9,315 | 39,186 | +1,484 | +4,258 | ▼-29,871 | -2,774 | -9.29% | 11.68% | 49.14% | 79,740 |
| 7 Apr 2026 | 10,586 | 41,280 | +1,271 | +2,094 | ▼-30,694 | -823 | -2.76% | 12.22% | 47.64% | 86,646 |
| 14 Apr 2026 | 9,637 | 43,734 | -949 | +2,454 | ▼-34,097 | -3,403 | -11.09% | 10.32% | 46.84% | 93,376 |
| 21 Apr 2026 | 8,372 | 41,645 | -1,265 | -2,089 | ▲-33,273 | +824 | +2.42% | 9.15% | 45.50% | 91,532 |
| 28 Apr 2026 | 6,359 | 41,580 | -2,013 | -65 | ▼-35,221 | -1,948 | -5.85% | 6.76% | 44.18% | 94,111 |
| 5 May 2026 | 7,145 | 41,666 | +786 | +86 | ▲-34,521 | +700 | +1.99% | 7.56% | 44.11% | 94,468 |
| 12 May 2026 | 5,602 | 41,799 | -1,543 | +133 | ▼-36,197 | -1,676 | -4.86% | 5.91% | 44.12% | 94,743 |
| 19 May 2026 | 6,284 | 43,221 | +682 | +1,422 | ▼-36,937 | -740 | -2.04% | 6.03% | 41.47% | 104,225 |
| 26 May 2026 | 7,118 | 42,258 | +834 | -963 | ▲-35,140 | +1,797 | +4.87% | 6.74% | 40.02% | 105,594 |
| 2 Jun 2026 | 6,245 | 39,154 | -873 | -3,104 | ▲-32,909 | +2,231 | +6.35% | 5.60% | 35.14% | 111,432 |
| 9 Jun 2026 | 7,335 | 44,000 | +1,090 | +4,846 | ▼-36,665 | -3,756 | -11.41% | 6.36% | 38.12% | 115,412 |
| 16 Jun 2026 | 7,594 | 47,652 | +259 | +3,652 | ▼-40,058 | -3,393 | -9.25% | 5.21% | 32.70% | 145,747 |
| 23 Jun 2026 | 7,975 | 49,069 | +381 | +1,417 | ▼-41,094 | -1,036 | -2.59% | 7.34% | 45.17% | 108,626 |
| 30 Jun 2026 | 7,975 | 46,933 | 0 | -2,136 | ▲-38,958 | +2,136 | +5.20% | 7.53% | 44.31% | 105,912 |
| 7 Jul 2026 | 10,561 | 47,975 | +2,586 | +1,042 | ▲-37,414 | +1,544 | +3.96% | 9.81% | 44.56% | 107,672 |
| 14 Jul 2026 | 9,909 | 46,865 | -652 | -1,110 | ▲-36,956 | +458 | +1.22% | 9.14% | 43.23% | 108,412 |
| 21 Jul 2026 | 9,817 | 44,059 | -92 | -2,806 | ▲-34,242 | +2,714 | +7.34% | 9.10% | 40.85% | 107,866 |
| 28 Jul 2026 | 10,117 | 43,579 | +300 | -480 | ▲-33,462 | +780 | +2.28% | 9.04% | 38.93% | 111,939 |
| 4 Aug 2026 | 11,270 | 44,092 | +1,153 | +513 | ▲-32,822 | +640 | +1.91% | 10.29% | 40.24% | 109,573 |
| 11 Aug 2026 | 9,773 | 42,235 | -1,497 | -1,857 | ▲-32,462 | +360 | +1.10% | 8.89% | 38.44% | 109,874 |
| 18 Aug 2026 | 14,041 | 41,319 | +4,268 | -916 | ▲-27,278 | +5,184 | +15.97% | 12.34% | 36.32% | 113,749 |
| 25 Aug 2026 | 19,938 | 39,884 | +5,897 | -1,435 | ▲-19,946 | +7,332 | +26.88% | 18.30% | 36.62% | 108,923 |
| 1 Sep 2026 | 19,912 | 42,788 | -26 | +2,904 | ▼-22,876 | -2,930 | -14.69% | 14.54% | 31.24% | 136,962 |
| 8 Sep 2026 | 17,273 | 47,258 | -2,639 | +4,470 | ▼-29,985 | -7,109 | -31.08% | 11.24% | 30.75% | 153,683 |
| 15 Sep 2026 | 20,263 | 49,251 | +2,990 | +1,993 | ▲-28,988 | +997 | +3.32% | 11.83% | 28.75% | 171,313 |
| 22 Sep 2026 | 22,189 | 48,941 | +1,926 | -310 | ▲-26,752 | +2,236 | +7.71% | 16.62% | 36.66% | 133,495 |
Every colored column uses the classic 3-color scale: red → yellow → green.
- The lowest value currently on screen shades red.
- The highest shades green.
- The midpoint shades yellow, sitting exactly at 50% between the column’s low and high.
The scale is relative to what you're viewing
Reading the Colors, Column by Column
LONG & SHORT
Read them like a candlestick chart: green = bullish, red = bearish, yellow = neutral. When longs are high for the period the cell turns green; when low, red. The short column reads the same way against its own range — always read each column against itself, then combine via Net Positions.
CHANGE LONG & CHANGE SHORT
Here color encodes direction of sentiment, not just size:
| Column | Action | Color | Reads as |
|---|---|---|---|
| Change Long | Longs added | Green | Bullish |
| Change Long | Longs closed | Red | Possibly bearish |
| Change Short | Shorts added | Red | Bearish |
| Change Short | Shorts closed | Green | Possibly bullish |
When both change columns point the same way — longs added and shorts closed — you have a strong, one-directional move with conviction. Always confirm it against Net Positions before acting.
NET POSITIONS
Same rule: color is relative to the values on screen, not to zero. So a positive net can still appear red if it’s near the bottom of the range you’re viewing — e.g. a net of +20,000 shades red if it once stood at +80,000 over the period. The color tells you the group is far less bullish than it was, even though it’s still net long. It answers “where does this week sit in the range?” — not “is the number positive?”
![]() CONTRACTS OF CHF 125,000 ©An original format byCOT-Reports.com SWISS FRANC - CME | ||||||||||
| DATE | LONG | SHORT | CHANGE LONG | CHANGE SHORT | NET POSITIONS | NET CHANGE | NET % CHANGE | % OI LONG | % OI SHORT | OPEN INTEREST |
|---|---|---|---|---|---|---|---|---|---|---|
| 31 Mar 2026 | 9,315 | 39,186 | +1,484 | +4,258 | ▼-29,871 | -2,774 | -9.29% | 11.68% | 49.14% | 79,740 |
| 7 Apr 2026 | 10,586 | 41,280 | +1,271 | +2,094 | ▼-30,694 | -823 | -2.76% | 12.22% | 47.64% | 86,646 |
| 14 Apr 2026 | 9,637 | 43,734 | -949 | +2,454 | ▼-34,097 | -3,403 | -11.09% | 10.32% | 46.84% | 93,376 |
| 21 Apr 2026 | 8,372 | 41,645 | -1,265 | -2,089 | ▲-33,273 | +824 | +2.42% | 9.15% | 45.50% | 91,532 |
| 28 Apr 2026 | 6,359 | 41,580 | -2,013 | -65 | ▼-35,221 | -1,948 | -5.85% | 6.76% | 44.18% | 94,111 |
| 5 May 2026 | 7,145 | 41,666 | +786 | +86 | ▲-34,521 | +700 | +1.99% | 7.56% | 44.11% | 94,468 |
| 12 May 2026 | 5,602 | 41,799 | -1,543 | +133 | ▼-36,197 | -1,676 | -4.86% | 5.91% | 44.12% | 94,743 |
| 19 May 2026 | 6,284 | 43,221 | +682 | +1,422 | ▼-36,937 | -740 | -2.04% | 6.03% | 41.47% | 104,225 |
| 26 May 2026 | 7,118 | 42,258 | +834 | -963 | ▲-35,140 | +1,797 | +4.87% | 6.74% | 40.02% | 105,594 |
| 2 Jun 2026 | 6,245 | 39,154 | -873 | -3,104 | ▲-32,909 | +2,231 | +6.35% | 5.60% | 35.14% | 111,432 |
| 9 Jun 2026 | 7,335 | 44,000 | +1,090 | +4,846 | ▼-36,665 | -3,756 | -11.41% | 6.36% | 38.12% | 115,412 |
| 16 Jun 2026 | 7,594 | 47,652 | +259 | +3,652 | ▼-40,058 | -3,393 | -9.25% | 5.21% | 32.70% | 145,747 |
| 23 Jun 2026 | 7,975 | 49,069 | +381 | +1,417 | ▼-41,094 | -1,036 | -2.59% | 7.34% | 45.17% | 108,626 |
| 30 Jun 2026 | 7,975 | 46,933 | 0 | -2,136 | ▲-38,958 | +2,136 | +5.20% | 7.53% | 44.31% | 105,912 |
| 7 Jul 2026 | 10,561 | 47,975 | +2,586 | +1,042 | ▲-37,414 | +1,544 | +3.96% | 9.81% | 44.56% | 107,672 |
| 14 Jul 2026 | 9,909 | 46,865 | -652 | -1,110 | ▲-36,956 | +458 | +1.22% | 9.14% | 43.23% | 108,412 |
| 21 Jul 2026 | 9,817 | 44,059 | -92 | -2,806 | ▲-34,242 | +2,714 | +7.34% | 9.10% | 40.85% | 107,866 |
| 28 Jul 2026 | 10,117 | 43,579 | +300 | -480 | ▲-33,462 | +780 | +2.28% | 9.04% | 38.93% | 111,939 |
| 4 Aug 2026 | 11,270 | 44,092 | +1,153 | +513 | ▲-32,822 | +640 | +1.91% | 10.29% | 40.24% | 109,573 |
| 11 Aug 2026 | 9,773 | 42,235 | -1,497 | -1,857 | ▲-32,462 | +360 | +1.10% | 8.89% | 38.44% | 109,874 |
| 18 Aug 2026 | 14,041 | 41,319 | +4,268 | -916 | ▲-27,278 | +5,184 | +15.97% | 12.34% | 36.32% | 113,749 |
| 25 Aug 2026 | 19,938 | 39,884 | +5,897 | -1,435 | ▲-19,946 | +7,332 | +26.88% | 18.30% | 36.62% | 108,923 |
| 1 Sep 2026 | 19,912 | 42,788 | -26 | +2,904 | ▼-22,876 | -2,930 | -14.69% | 14.54% | 31.24% | 136,962 |
| 8 Sep 2026 | 17,273 | 47,258 | -2,639 | +4,470 | ▼-29,985 | -7,109 | -31.08% | 11.24% | 30.75% | 153,683 |
| 15 Sep 2026 | 20,263 | 49,251 | +2,990 | +1,993 | ▲-28,988 | +997 | +3.32% | 11.83% | 28.75% | 171,313 |
| 22 Sep 2026 | 22,189 | 48,941 | +1,926 | -310 | ▲-26,752 | +2,236 | +7.71% | 16.62% | 36.66% | 133,495 |
NET CHANGE & NET % CHANGE
NET CHANGE (green = more net-long, red = more net-short) shows which way the net just moved; the ▲/▼ arrow in the Net cell mirrors it. NET % CHANGE puts that move in context — a swing of 5,000 contracts is enormous on a net of 10,000 (+50%) but a ripple on 500,000. The sign always reflects the direction of the move.
PRICE (Premium)
Shaded on the same scale so you can see price highs and lows alongside positioning — the weekly settlement price on the report’s Tuesday date, not a live quote.
Your Controls: Category & Time Period
The Simplified report defaults to Non-Commercial (Large Speculators) — the “smart money” whose positioning tends to lead price. But you can switch the trader category to:
- Non-Commercial (Large Speculators) — hedge funds & professional speculators (default)
- Commercial (Hedgers) — producers & users hedging real business risk
- Non-Reportable (Small Traders) — positions below the CFTC’s reportable threshold
You also choose the time period: YTD, 3M and 6M are open to everyone; a free account unlocks 1Y–10Y and a custom date range. Because the color scale recalibrates to your window, switching periods is itself an analysis tool — a net that looks green on 3 months can turn red on 5 years.
Aggregate the data: grouped reports
COT data is weekly — one row per Tuesday. That’s precise, but the week-to-week wiggles can hide the bigger move. The Group Reports control rolls those weekly rows up into larger periods:
- Individual — every weekly report (default)
- Bi-Weekly · Monthly · Quarterly · Semi-Annual · Annual — the weeks aggregated into one row per period
Aggregating smooths out the weekly noise so the underlying trend stands out: a Monthly view shows where speculators have moved over the whole year at a glance, and each grouped row’s Net Change is measured between the first and last report in the period — the net shift across that month or quarter, not a single week’s blip. It’s the position trader’s lens, where Individual is the active trader’s. (Individual is open to everyone; the grouped views unlock with a free account.)
Two Halves of the Same Picture
A candlestick chart tells you what price did. A COT report tells you who was positioned which way while it happened — and whether the big speculative players were building into the move or bailing out of it.
On their own, each is incomplete. A breakout is just a breakout — but a breakout while large speculators are aggressively adding longs and covering shorts has fuel behind it. Reading the two together is the whole point.
The One Rule You Cannot Forget: Currencies Are Flipped
Every currency in the COT reports is quoted against the dollar, from the foreign currency’s side. The Japanese Yen report is JPY/USD, the Swiss Franc report is CHF/USD, and so on. So the report reads 180° flipped from the pair most traders watch:
If you plan to go short USD/JPY, you want to see long positions rising in the Japanese Yen (JPY/USD) report. A strong Yen on the report = a weak USD/JPY on the chart.
Keep this straight and the report becomes intuitive. Forget it and every signal reads backwards.
Worked Example: Yen Report vs USD/JPY Chart
Let’s read the Japanese Yen COT report against the USD/JPY price chart over the same window. Pull up USD/JPY on your own charting platform — or use the Charts page on this site, which plots positioning and price together.
![]() CONTRACTS OF JPY 12,500,000 ©An original format byCOT-Reports.com JAPANESE YEN - CME | ||||||||||
| DATE | LONG | SHORT | CHANGE LONG | CHANGE SHORT | NET POSITIONS | NET CHANGE | NET % CHANGE | % OI LONG | % OI SHORT | OPEN INTEREST |
|---|---|---|---|---|---|---|---|---|---|---|
| 31 Mar 2026 | 95,356 | 168,228 | -2,915 | +7,151 | ▼-72,872 | -10,066 | -13.81% | 27.62% | 48.72% | 345,276 |
| 7 Apr 2026 | 91,560 | 185,302 | -3,796 | +17,074 | ▼-93,742 | -20,870 | -28.64% | 26.21% | 53.04% | 349,373 |
| 14 Apr 2026 | 102,114 | 185,322 | +10,554 | +20 | ▲-83,208 | +10,534 | +11.24% | 28.82% | 52.30% | 354,344 |
| 21 Apr 2026 | 101,386 | 195,846 | -728 | +10,524 | ▼-94,460 | -11,252 | -13.52% | 28.82% | 55.67% | 351,782 |
| 28 Apr 2026 | 106,530 | 208,589 | +5,144 | +12,743 | ▼-102,059 | -7,599 | -8.04% | 28.58% | 55.95% | 372,780 |
| 5 May 2026 | 109,035 | 170,773 | +2,505 | -37,816 | ▲-61,738 | +40,321 | +39.51% | 30.80% | 48.24% | 354,005 |
| 12 May 2026 | 100,155 | 175,257 | -8,880 | +4,484 | ▼-75,102 | -13,364 | -21.65% | 27.66% | 48.41% | 362,042 |
| 19 May 2026 | 106,603 | 200,508 | +6,448 | +25,251 | ▼-93,905 | -18,803 | -25.04% | 26.88% | 50.56% | 396,573 |
| 26 May 2026 | 112,993 | 227,660 | +6,390 | +27,152 | ▼-114,667 | -20,762 | -22.11% | 26.44% | 53.28% | 427,294 |
| 2 Jun 2026 | 114,849 | 244,416 | +1,856 | +16,756 | ▼-129,567 | -14,900 | -12.99% | 22.72% | 48.35% | 505,555 |
| 9 Jun 2026 | 121,520 | 267,338 | +6,671 | +22,922 | ▼-145,818 | -16,251 | -12.54% | 24.06% | 52.93% | 505,075 |
| 16 Jun 2026 | 117,375 | 267,507 | -4,145 | +169 | ▼-150,132 | -4,314 | -2.96% | 22.54% | 51.36% | 520,825 |
| 23 Jun 2026 | 113,698 | 259,802 | -3,677 | -7,705 | ▲-146,104 | +4,028 | +2.68% | 26.38% | 60.27% | 431,030 |
| 30 Jun 2026 | 111,872 | 266,964 | -1,826 | +7,162 | ▼-155,092 | -8,988 | -6.15% | 25.49% | 60.84% | 438,825 |
| 7 Jul 2026 | 112,247 | 236,025 | +375 | -30,939 | ▲-123,778 | +31,314 | +20.19% | 28.20% | 59.29% | 398,103 |
| 14 Jul 2026 | 115,965 | 238,628 | +3,718 | +2,603 | ▲-122,663 | +1,115 | +0.90% | 29.25% | 60.18% | 396,514 |
| 21 Jul 2026 | 107,590 | 259,715 | -8,375 | +21,087 | ▼-152,125 | -29,462 | -24.02% | 25.39% | 61.28% | 423,796 |
| 28 Jul 2026 | 101,271 | 264,683 | -6,319 | +4,968 | ▼-163,412 | -11,287 | -7.42% | 23.42% | 61.22% | 432,366 |
| 4 Aug 2026 | 147,228 | 192,701 | +45,957 | -71,982 | ▲-45,473 | +117,939 | +72.17% | 35.11% | 45.95% | 419,393 |
| 11 Aug 2026 | 134,188 | 176,273 | -13,040 | -16,428 | ▲-42,085 | +3,388 | +7.45% | 34.24% | 44.98% | 391,874 |
| 18 Aug 2026 | 128,932 | 181,825 | -5,256 | +5,552 | ▼-52,893 | -10,808 | -25.68% | 33.86% | 47.75% | 380,811 |
| 25 Aug 2026 | 128,340 | 191,638 | -592 | +9,813 | ▼-63,298 | -10,405 | -19.67% | 33.40% | 49.88% | 384,216 |
| 1 Sep 2026 | 117,169 | 209,396 | -11,171 | +17,758 | ▼-92,227 | -28,929 | -45.70% | 28.45% | 50.84% | 411,882 |
| 8 Sep 2026 | 178,791 | 167,995 | +61,622 | -41,401 | ▲10,796 | +103,023 | +111.71% | 35.78% | 33.62% | 499,635 |
| 15 Sep 2026 | 237,951 | 117,592 | +59,160 | -50,403 | ▲120,359 | +109,563 | +1014.85% | 43.84% | 21.66% | 542,802 |
| 22 Sep 2026 | 192,274 | 120,292 | -45,677 | +2,700 | ▼71,982 | -48,377 | -40.19% | 50.77% | 31.76% | 378,701 |
Suppose, over the window, the Non-Commercial rows show (illustrative figures — read the live numbers above):
| Start of window | End of window | |
|---|---|---|
| LONG | 50,000 | 19,000 |
| SHORT | 18,000 | 41,000 |
| NET POSITIONS | +32,000 | −22,000 |
Two things happened at once: longs were closed (50k → 19k, Change Long red) and shorts were opened (18k → 41k, Change Short red). Both change columns red, pointing the same way. Net Positions confirms it: it fell from +32,000 to −22,000, flipping the Yen from net long (bullish JPY) to net short (bearish JPY).
Now flip it for the chart. Bearish on the Yen (JPY/USD) = bullish on USD/JPY. So over the same window, speculators were betting the Yen down — the same as betting USD/JPY up. On your USD/JPY chart over the matching dates, price should be rising while the report’s net was falling. Positioning and price agree, once you account for the flip.
Open the Charts page — positioning and price on one chartThe whole technique, in one line
— or skip the inversion entirely: turn on 180° View and the report’s colors already read from the USD/JPY side, so a falling Yen shows up as a rising dollar pair without you flipping anything.
Confirming with the Dollar Index
Strengthen a USD/JPY read by checking the Dollar Index (DXY) report. A strong dollar against a weak Yen is doubly bullish for USD/JPY. If the DXY report shows the net improving — longs added, no shorts closing — that’s the dollar getting stronger on its own report at the same time the Yen weakens on its own. Two independent reports pointing the same way is exactly the confirmation worth waiting for.
![]() CONTRACTS OF USD Index x 1,000 ©An original format byCOT-Reports.com US DOLLAR INDEX - ICE | ||||||||||
| DATE | LONG | SHORT | CHANGE LONG | CHANGE SHORT | NET POSITIONS | NET CHANGE | NET % CHANGE | % OI LONG | % OI SHORT | OPEN INTEREST |
|---|---|---|---|---|---|---|---|---|---|---|
| 31 Mar 2026 | 21,708 | 18,027 | +1,251 | +1,187 | ▲3,681 | +64 | +1.74% | 56.04% | 46.54% | 38,735 |
| 7 Apr 2026 | 23,084 | 17,573 | +1,376 | -454 | ▲5,511 | +1,830 | +49.71% | 63.12% | 48.05% | 36,573 |
| 14 Apr 2026 | 18,970 | 13,800 | -4,114 | -3,773 | ▼5,170 | -341 | -6.19% | 57.64% | 41.93% | 32,911 |
| 21 Apr 2026 | 17,617 | 12,634 | -1,353 | -1,166 | ▼4,983 | -187 | -3.62% | 57.48% | 41.22% | 30,651 |
| 28 Apr 2026 | 17,180 | 12,672 | -437 | +38 | ▼4,508 | -475 | -9.53% | 56.12% | 41.40% | 30,611 |
| 5 May 2026 | 17,048 | 16,355 | -132 | +3,683 | ▼693 | -3,815 | -84.63% | 52.46% | 50.33% | 32,496 |
| 12 May 2026 | 18,912 | 15,725 | +1,864 | -630 | ▲3,187 | +2,494 | +359.88% | 58.90% | 48.98% | 32,108 |
| 19 May 2026 | 21,403 | 21,882 | +2,491 | +6,157 | ▼-479 | -3,666 | -115.03% | 52.68% | 53.86% | 40,626 |
| 26 May 2026 | 22,732 | 21,882 | +1,329 | 0 | ▲850 | +1,329 | +277.45% | 53.77% | 51.76% | 42,278 |
| 2 Jun 2026 | 24,584 | 20,826 | +1,852 | -1,056 | ▲3,758 | +2,908 | +342.12% | 57.05% | 48.33% | 43,090 |
| 9 Jun 2026 | 27,908 | 26,524 | +3,324 | +5,698 | ▼1,384 | -2,374 | -63.17% | 55.50% | 52.75% | 50,285 |
| 16 Jun 2026 | 31,180 | 17,983 | +3,272 | -8,541 | ▲13,197 | +11,813 | +853.54% | 63.10% | 36.39% | 49,411 |
| 23 Jun 2026 | 34,278 | 21,350 | +3,098 | +3,367 | ▼12,928 | -269 | -2.04% | 62.43% | 38.88% | 54,908 |
| 30 Jun 2026 | 32,524 | 19,508 | -1,754 | -1,842 | ▲13,016 | +88 | +0.68% | 59.89% | 35.92% | 54,306 |
| 7 Jul 2026 | 31,921 | 18,652 | -603 | -856 | ▲13,269 | +253 | +1.94% | 59.80% | 34.94% | 53,384 |
| 14 Jul 2026 | 31,641 | 18,468 | -280 | -184 | ▼13,173 | -96 | -0.72% | 59.37% | 34.65% | 53,293 |
| 21 Jul 2026 | 33,270 | 17,656 | +1,629 | -812 | ▲15,614 | +2,441 | +18.53% | 61.66% | 32.72% | 53,953 |
| 28 Jul 2026 | 35,339 | 18,142 | +2,069 | +486 | ▲17,197 | +1,583 | +10.14% | 60.67% | 31.14% | 58,251 |
| 4 Aug 2026 | 35,247 | 12,748 | -92 | -5,394 | ▲22,499 | +5,302 | +30.83% | 67.58% | 24.44% | 52,154 |
| 11 Aug 2026 | 32,651 | 11,242 | -2,596 | -1,506 | ▼21,409 | -1,090 | -4.84% | 65.91% | 22.69% | 49,541 |
| 18 Aug 2026 | 29,582 | 10,503 | -3,069 | -739 | ▼19,079 | -2,330 | -10.88% | 61.72% | 21.91% | 47,928 |
| 25 Aug 2026 | 29,042 | 10,360 | -540 | -143 | ▼18,682 | -397 | -2.08% | 60.56% | 21.60% | 47,953 |
| 1 Sep 2026 | 28,240 | 11,215 | -802 | +855 | ▼17,025 | -1,657 | -8.87% | 56.46% | 22.42% | 50,020 |
| 8 Sep 2026 | 28,407 | 10,803 | +167 | -412 | ▲17,604 | +579 | +3.40% | 49.10% | 18.67% | 57,858 |
| 15 Sep 2026 | 25,971 | 15,378 | -2,436 | +4,575 | ▼10,593 | -7,011 | -39.83% | 59.37% | 35.15% | 43,744 |
| 22 Sep 2026 | 27,768 | 17,438 | +1,797 | +2,060 | ▼10,330 | -263 | -2.48% | 59.94% | 37.64% | 46,328 |
Trading Crosses (Non-USD Pairs)
For a cross like GBP/CAD there’s no single report — you weigh both. To go long GBP/CAD you want GBP strong (rising net in the British Pound report) and CAD weak (falling net in the Canadian Dollar report). Read both and you’re trading relative strength. The easiest way is the Comparison page — pick any two markets and read both on one screen.
Putting It Together
The workflow, every week:
- Open the report for the currency you care about — remember it’s quoted vs USD.
- Read the colors — Net Positions for the level, Net Change and the ▲/▼ arrow for the direction, the Change columns for what drove it.
- Flip it if needed to get the pair you trade.
- Confirm against price (the Price column or the chart) and, where relevant, the DXY or the second leg of a cross.
- Compare two markets on the Comparison page for relative strength.
The COT report won’t time your entry to the candle — that’s the chart’s job. What it gives you is context the chart can’t show: whether the people who move size are leaning into the move with you, or quietly getting out.
Final Words
You now have the full toolkit: where the data comes from, what every column means, how to read the colors at a glance, and how to line a COT report up against the chart. A few things to carry with you:
- The COT report is context, not a trigger — it shows how the market is positioned, not when to enter. Pair it with your own chart analysis.
- Always read currencies against the dollar, then flip for the pair you actually trade.
- Colors are relative to the window on screen, not to zero — change the time period and the picture changes with it.
- Confirm, don’t assume — Net Positions for the level, Net Change for the direction, a second report for conviction.
Everything here is live on the site — open the Simplified and Detailed reports, use the Comparison page, and explore the Charts to see positioning and price move together.
Risk warning
Thank you for investing in your trading education. Best of luck on your journey.

