Larry Williams and the COT Report: the COT Index Explained
How Larry Williams read the COT report: his 1987 contest result, his 2005 COT book, the COT Index formula, the 80/20 readings and what the method cannot do.
ew names are tied to the CFTC Commitments of Traders report as closely as Larry Williams’. The American futures trader and author wrote a whole book about the report, and the COT Index — a simple way to see where a group of traders stands against its own history — is the tool most often associated with his work.
This article looks at what he is known for, what his COT book teaches (in our own words), how the COT Index is calculated, which CFTC data the classic approach reads, how to look at the same numbers on COT-Reports.com, and — just as important — what the method does not do. COT-Reports.com is not affiliated with Larry Williams; his name is used only to describe his published work.
The 1987 World Cup result
In 1987 Williams won the World Cup Championship of Futures Trading, a year-long contest traded in real-money accounts. The organiser lists his net return as 11,376%; his publisher, Wiley, describes it as turning $10,000 into more than $1.1 million in twelve months.
It is a historical result: one account, one year, one set of market conditions. Past results do not predict future results, and a contest record says nothing about what anyone else would earn.
The book: Trade Stocks and Commodities with the Insiders
In September 2005 John Wiley & Sons published “Trade Stocks and Commodities with the Insiders: Secrets of the COT Report” in its Wiley Trading series. The “insiders” of the title are the commercials: the producers, merchants, processors and users of a commodity who trade futures to hedge their business.
The core idea, in our words: commercials tend to add to their buying while prices fall and to their selling while prices rise, because they are protecting real business exposure rather than chasing a trend. Over short stretches that makes them look wrong — Williams calls them “dumb as foxes” — but when their net position reaches an extreme compared with its own past, it shows where the best-informed hedging money stands.
The book builds on that idea in chapters on watching and understanding the commercials, the COT Index, large traders, open interest, volume and charts, and ends with putting the theory to work.
The COT Index formula
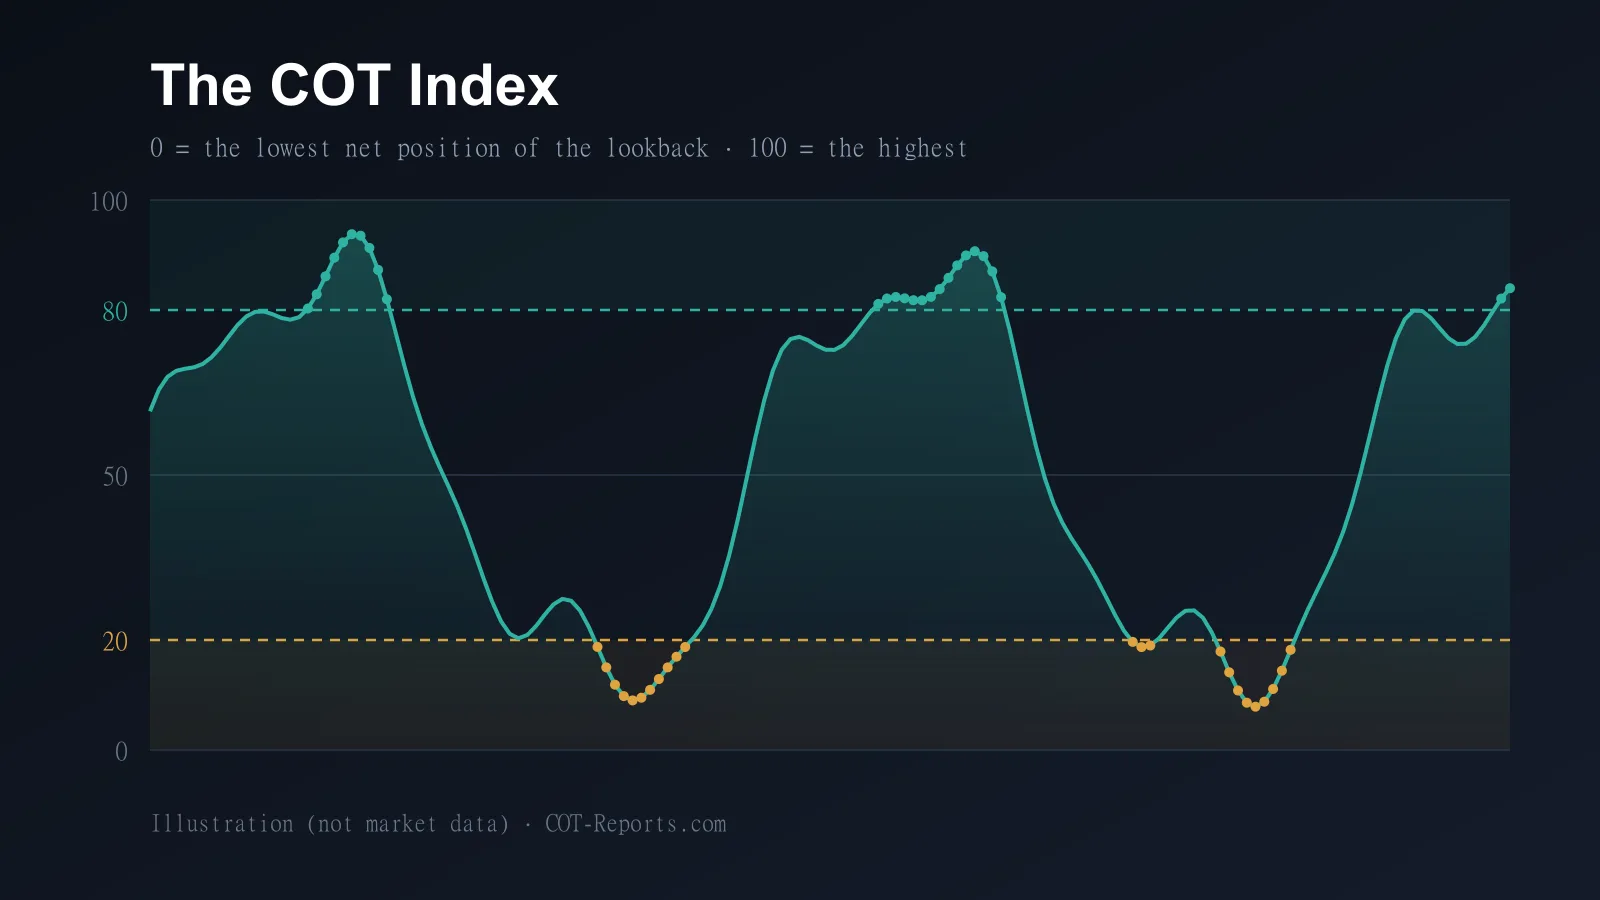
COT Index = (this week’s net position − the lowest net position of the lookback) ÷ (the highest net position of the lookback − the lowest) × 100.
The net position is a group’s long contracts minus its short contracts — in the classic approach, the commercials’. The result always lands between 0 and 100: 100 means the group is as net-long as it has been at any point in the window, 0 means as net-short as it has been.
An illustration with round numbers: if over the last three years the commercial net position ranged from −120,000 to +40,000 contracts and this week it is +8,000, the index is (8,000 + 120,000) ÷ (40,000 + 120,000) × 100 = 80. The same 8,000 contracts would read very differently in a market whose range was −10,000 to +10,000 — which is the point: the index compares each market with itself.
Three years, and the 80/20 readings
The window most often cited for Williams’ approach is three years — about 156 weekly reports. Shorter windows, 26 weeks in particular, are common variants, and some published accounts describe 26 weeks as his window; we could not check either against the book itself. A longer window gives fewer, more meaningful extremes; a shorter one reacts faster but touches 0 and 100 more often.
Readings above 80 are usually treated as the commercials being near the most bullish they have been in the window; readings below 20 as near the most bearish. 80/20 is a convention, not a law — other authors use 75/25 or 90/10 — and a reading in the zone marks an extreme in positioning, not a trade.
Futures Only or Futures & Options Combined?
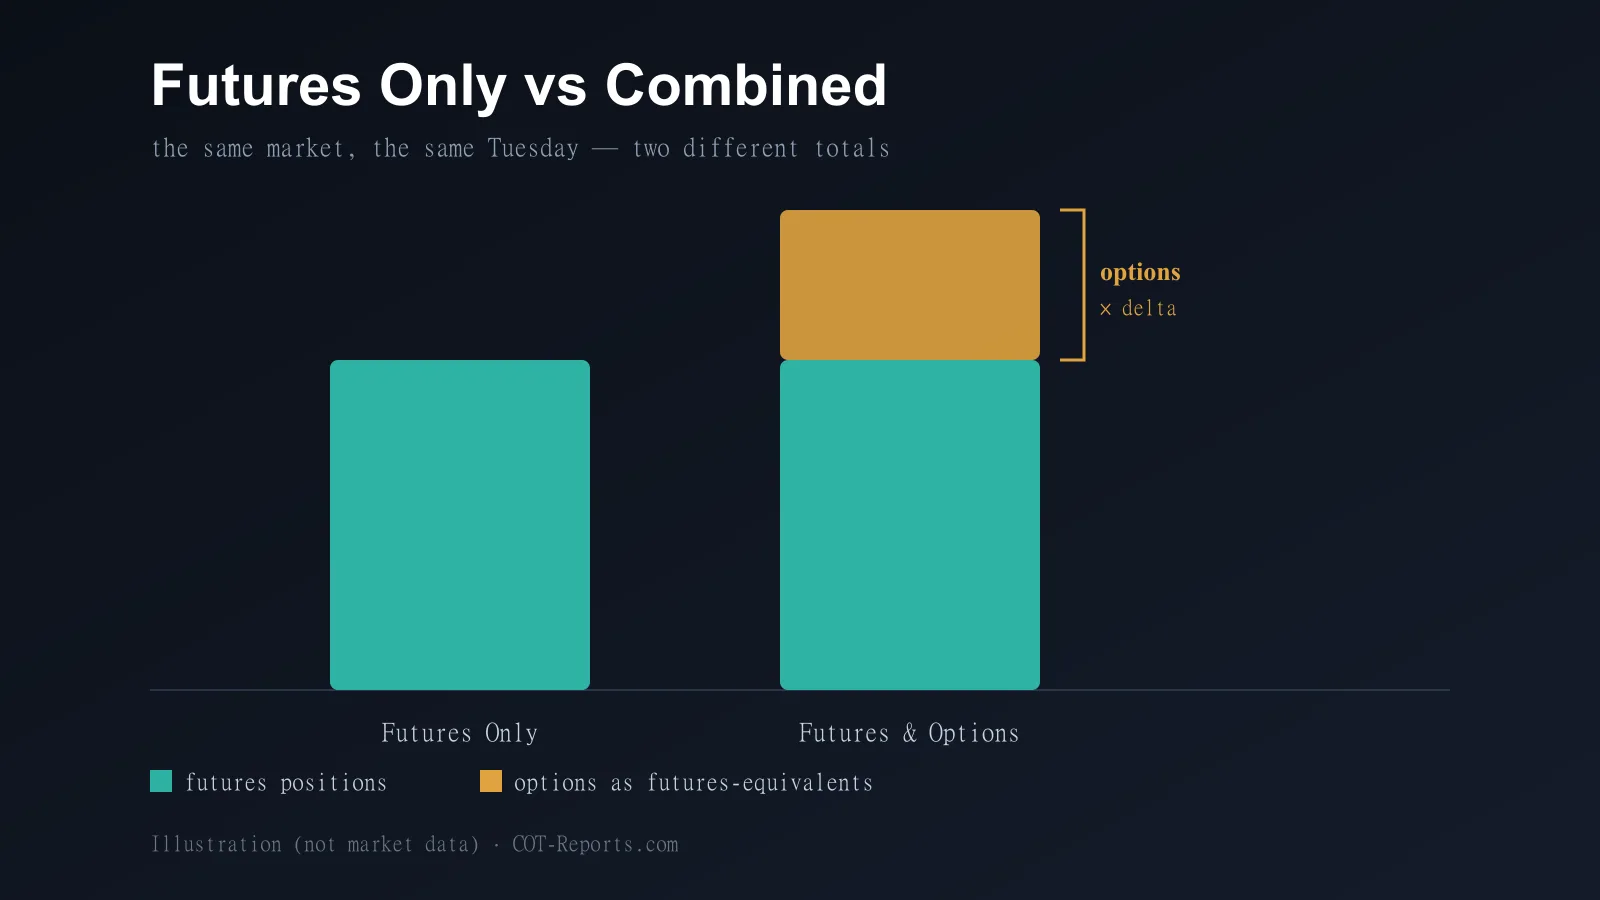
The classic approach reads the Commercial category of the Legacy COT report. The CFTC publishes that report in two versions every week: Futures Only, and Futures & Options Combined, which adds option positions converted to futures-equivalent contracts.
We did not find a primary statement from Williams on which of the two versions he used. In markets with a large options market the two versions can differ noticeably, so it is worth comparing them before relying on either.
How to see it on COT-Reports.com
The COT Index page calculates exactly this formula from the weekly Legacy data, for every market the CFTC reports — Futures Only by default, and Futures & Options Combined with Premium through its variant switch. To reproduce the classic view, pick a market, choose the Commercial (Hedgers) category and the 156W (3Y) lookback. The page opens on Non-Commercial and 52W, so both need switching. The 26W and 52W lookbacks are open to everyone; 156W (3Y) and 260W (5Y) need a free account. The chart marks the zones above 80 and below 20 as “Extreme long” and “Extreme short”.
To see the raw numbers behind the index, the COT Report Simplified and COT Report Detailed tables show the commercials’ longs, shorts and net position week by week. They have the same variant switch: Futures Only is free, Futures & Options Combined is Premium. Premium’s Advanced Charts also show the COT Index across several lookbacks at once.
What the method does not do
It is not a timing tool on its own. Williams himself describes the COT reading as one condition among several, paired with a price trigger, as he explained in a 2024 interview. Commercials hedge: they can sit at an extreme for months while prices keep moving against them.
The data is also late and coarse. The report shows positions as of Tuesday’s close and is normally released on Friday at 3:30 p.m. Eastern Time, and the CFTC notes that the same trader can be classified as commercial in one market and non-commercial in another, and may be reclassified.
Academic support is limited. Sanders, Irwin and Merrin (2009) found little evidence that large-trader positions forecast returns in agricultural futures markets. Treat the COT Index as context about positioning, not as a forecast. This article is educational and is not trading advice; past results do not predict future results.
Sources
- World Cup Trading Championships — Larry Williams (1987 result, 11,376%)
- Wiley — Trade Stocks and Commodities with the Insiders: Secrets of the COT Report (2005), book page and author bio
- Stanford Libraries SearchWorks — catalogue record of the book
- Perlego — the book’s table of contents and preview (source of the quote)
- COTInsight — “COT Index explained” (lookback windows, 80/20 as a convention; 2026)
- COT Unchained — Williams Commercial Index (a 26-week window)
- CFTC — Commitments of Traders reports (Futures Only and Futures-and-Options Combined)
- CFTC — Commitments of Traders Explanatory Notes (commercial classification, release timing)
- Sanders, Irwin & Merrin — “Smart Money: The Forecasting Ability of CFTC Large Traders in Agricultural Futures Markets”, Journal of Agricultural and Resource Economics 34(2), 2009
- Better System Trader — interview with Larry Williams on using indicators (2024)
COT-Reports.com is not affiliated with Larry Williams. His name and work are cited here for information only.