


Disaggregated Futures & Options Report — Detailed
Producer · Swap Dealers · Managed Money · Other · Updated every Friday
The CFTC Disaggregated release with all five trader categories side-by-side — Producer/Merchant, Swap Dealers, Managed Money, Other Reportables, and Non-Reportables. See where commodity-side hedgers are leaning, where Managed Money is crowded, and the weekly change for every category in one row. Built for grains, metals, energies, softs and livestock.
The latest CFTC Commitments of Traders (COT) report (Disaggregated) was released on Friday, 9 October 2026, reflecting futures positions as of the close of trading on Tuesday, 6 October 2026.
 GOLDGC-COMEX
Premium Report
This report format is available exclusively for COT Premium subscribers.
- 9 premium report formats
- Heatmap
- Advanced Charts
- CSV export
- Price column
- 20+ years of data (since 2006, Legacy since 1986)
- Futures Only & Futures & Options Combined on every report and chart
Price column unlocked on every COT report table
Currently showing: GOLD - COMMODITY EXCHANGE INC. | 26 reports | 14 Apr 2026 to 6 Oct 2026 · Variant: Futures & Options Combined
About the Detailed Disaggregated COT Report
The Detailed Disaggregated COT Report displays all 5 CFTC trader categories — Producer/Merchant, Swap Dealers, Managed Money, Other Reportables, Non-Reportables — side-by-side in one 17-column table. Released every Friday at 3:30 PM ET, the Detailed view is built for analysts who compare the entire CFTC bucket structure for one market across recent weeks without switching panels.
- Source: U.S. Commodity Futures Trading Commission (CFTC)
- Release schedule: Every Friday, 3:30 PM ET (delayed on US federal holidays)
- Markets covered: All physical commodity futures (agriculture, metals, energies, softs)
- Trader categories: Producer/Merchant, Swap Dealers, Managed Money, Other Reportables, Non-Reportable
Frequently Asked Questions
What does the Detailed Disaggregated COT Report show?
The Detailed view stacks all 5 CFTC Disaggregated categories in one wide table. For each category you see Longs, Shorts and Net Position, next to the report date and the market's close price. This gives you the full picture for one market across the last several CFTC releases — useful for spotting how Producer hedging and Managed Money speculation move against each other week-to-week.
How is the Detailed view different from the Simplified one?
Simplified focuses on one trader category at a time and adds richer per-row metrics (Net % Change, OI%). Detailed shows every category in the same row so the entire bucket structure reads at a glance — ideal when comparing how different participant groups stack against each other on the same week.
Why does the Detailed table have so many columns?
Each of the 5 trader categories gets 3 columns (Longs, Shorts, Net Position), framed by the report Date and the market's Close Price — 17 columns in all. The wide format is intentional — it lets you cross-reference category positioning without flipping views.
How do I read Non-Reportables in this view?
Non-Reportables is the residual: traders below the CFTC reporting threshold (small / retail). It is calculated as Total Open Interest minus the reported categories. In the Detailed table it sits as the rightmost trader column — a contrarian indicator when it crowds at extremes.
Can I export the Detailed table to CSV?
Yes — Premium subscribers can export every visible column directly from the toolbar. The CSV preserves Long, Short, and Net per category plus Open Interest, with Date as the first column for direct loading into Excel, Google Sheets, or Python.
How are weekly reports aggregated when I group them?
When you switch the Group Reports filter from Individual to Bi-Weekly, Monthly, Quarterly, Half-Year or Yearly, the underlying weekly CFTC reports are combined as follows. Snapshot columns (Long, Short, Spreading, Open Interest) are averaged across the period — a monthly row shows the average position across the 4-5 weeks that fall inside that month. Flow columns (Change Long, Change Short, Change OI) are summed, because they represent weekly deltas and the period total is the cumulative flow. NET % CHANGE uses an endpoint formula: it compares the net position in the last week of the period to the net position in the first week, expressed as a percentage. The small ×N chip on the DATE cell shows exactly how many weekly reports were aggregated into that row.
Explore All Report Formats
Unlock Every COT Report Format.
Every COT Report with Advanced Analytics
Go beyond the free Legacy reports: the Disaggregated, TFF and Supplemental formats, custom date ranges back to 1986, the Positioning Heatmap, Advanced Charts and CSV export.
REPORTS & HISTORY
- ✓Disaggregated — Managed Money & Swap Dealers
- ✓Traders in Financial Futures (TFF) — Leveraged Funds & Asset Managers
- ✓Supplemental — Commodity Index Traders
- ✓Simplified, Detailed & Latest views of all three
- ✓Custom date ranges, back to 1986
- ✓Both CFTC variants of every report, one click apart
DATA & TOOLS
- ✓Close Price column & CSV export
- ✓Positioning Heatmap
- ✓Advanced Charts & COT Volume Profile
- ✓Custom Weekly Summary & My Markets watchlist
- ✓Table screenshots (PNG) with no daily limit
- ✓The complete How to Read the COT Reports guide (3-month and annual plans)


 Any Prop Firm.
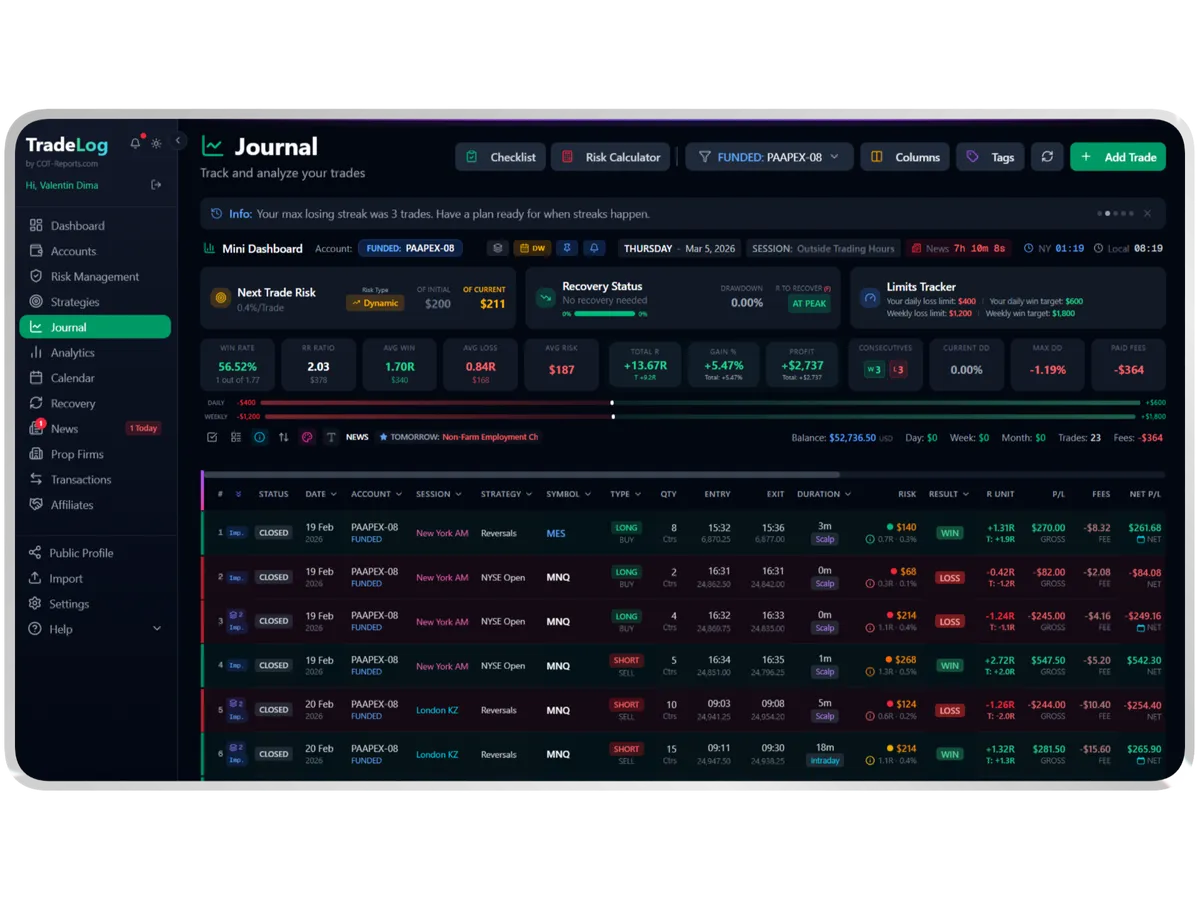
Automated Trading Journal
Auto-sync trades from MetaTrader, NinjaTrader, cTrader, Tradovate and more. Built-in analytics, prop-firm tracking, risk management and multi-account support. Basic and Premium include free EAs, a free cBot and a free NT Add-On.










COT-Reports Marketplace
Traders build it. Traders use it.
Probably the best trading tools, made by traders for the COT-Reports community. Buy what you need, or list what you built.
 COT-Reports.com
Every Friday, 35 markets land in Telegram. FREE.
The COT Report Simplified for each market in the map, plus the Weekly Summary, minutes after the CFTC publishes. Between Fridays, the bot sends any of them on request and keeps a free trading journal.