
Simplified COT Report
Net positions · Free for every CFTC market · Updated every Friday
The free Legacy COT view: net positions for Non-Commercials, Commercials and Non-Reportables across every tracked CFTC futures market. Click any market to see the full historical chart, or compare a market across YTD / 3M / 6M without an account.
The latest CFTC Commitments of Traders (COT) report (Legacy, Futures-Only) was released on Friday, 25 September 2026, reflecting futures positions as of the close of trading on Tuesday, 22 September 2026.
The Simplified COT Report shows weekly Non-Commercial (large speculator) positions in +380 CFTC futures markets in a single compact table — long, short, net positions and weekly changes — released every Friday at 3:30 PM Eastern Time by the U.S. Commodity Futures Trading Commission.
- Source: U.S. Commodity Futures Trading Commission (CFTC)
- Release schedule: Every Friday, 3:30 PM ET (delayed on US federal holidays)
- Markets covered: All 380 CFTC futures markets (Legacy Futures Only)
- Trader categories: Non-Commercial, Commercial, Non-Reportable
 EURO FX6E-CME
 CONTRACTS OF EUR 125,000 ©An original format byCOT-Reports.com EURO FX - CMENon-Commercial | |||||||||||
| DATE | LONG | SHORT | CHANGE LONG | CHANGE SHORT | NET POSITIONS | NET CHANGE | NET % CHANGE | % OI LONG | % OI SHORT | OPEN INTEREST | PRICE |
|---|---|---|---|---|---|---|---|---|---|---|---|
| 31 Mar 2026 | 200,168 | 199,661 | +143 | +8,915 | ▼507 | -8,772 | -1730.18% | 25.85% | 25.79% | 774,237 | |
| 7 Apr 2026 | 200,946 | 208,487 | +778 | +8,826 | ▼-7,541 | -8,048 | -1587.38% | 25.93% | 26.90% | 775,043 | |
| 14 Apr 2026 | 214,639 | 188,621 | +13,693 | -19,866 | ▲26,018 | +33,559 | +445.02% | 27.21% | 23.91% | 788,828 | |
| 21 Apr 2026 | 217,407 | 176,083 | +2,768 | -12,538 | ▲41,324 | +15,306 | +58.83% | 27.50% | 22.27% | 790,622 | |
| 28 Apr 2026 | 217,091 | 181,379 | -316 | +5,296 | ▼35,712 | -5,612 | -13.58% | 27.09% | 22.63% | 801,430 | |
| 5 May 2026 | 217,474 | 185,272 | +383 | +3,893 | ▼32,202 | -3,510 | -9.83% | 26.65% | 22.71% | 815,942 | |
| 12 May 2026 | 224,002 | 183,802 | +6,528 | -1,470 | ▲40,200 | +7,998 | +24.84% | 27.01% | 22.16% | 829,377 | |
| 19 May 2026 | 233,251 | 199,738 | +9,249 | +15,936 | ▼33,513 | -6,687 | -16.63% | 28.24% | 24.18% | 826,019 | |
| 26 May 2026 | 223,055 | 193,629 | -10,196 | -6,109 | ▼29,426 | -4,087 | -12.20% | 27.06% | 23.49% | 824,224 | |
| 2 Jun 2026 | 235,442 | 186,576 | +12,387 | -7,053 | ▲48,866 | +19,440 | +66.06% | 27.95% | 22.15% | 842,424 | |
| 9 Jun 2026 | 219,564 | 205,632 | -15,878 | +19,056 | ▼13,932 | -34,934 | -71.49% | 25.19% | 23.59% | 871,507 | |
| 16 Jun 2026 | 228,005 | 193,652 | +8,441 | -11,980 | ▲34,353 | +20,421 | +146.58% | 25.48% | 21.65% | 894,671 | |
| 23 Jun 2026 | 247,332 | 217,174 | +19,327 | +23,522 | ▼30,158 | -4,195 | -12.21% | 31.49% | 27.65% | 785,477 | |
| 30 Jun 2026 | 235,658 | 234,559 | -11,674 | +17,385 | ▼1,099 | -29,059 | -96.36% | 29.83% | 29.69% | 790,076 | |
| 7 Jul 2026 | 223,430 | 239,657 | -12,228 | +5,098 | ▼-16,227 | -17,326 | -1576.52% | 28.11% | 30.15% | 794,833 | |
| 14 Jul 2026 | 230,307 | 242,912 | +6,877 | +3,255 | ▲-12,605 | +3,622 | +22.32% | 28.81% | 30.38% | 799,495 | |
| 21 Jul 2026 | 220,465 | 261,803 | -9,842 | +18,891 | ▼-41,338 | -28,733 | -227.95% | 27.56% | 32.72% | 800,061 | |
| 28 Jul 2026 | 204,975 | 277,422 | -15,490 | +15,619 | ▼-72,447 | -31,109 | -75.26% | 25.00% | 33.84% | 819,806 | |
| 4 Aug 2026 | 201,847 | 259,938 | -3,128 | -17,484 | ▲-58,091 | +14,356 | +19.82% | 25.23% | 32.50% | 799,909 | |
| 11 Aug 2026 | 197,186 | 257,196 | -4,661 | -2,742 | ▼-60,010 | -1,919 | -3.30% | 24.59% | 32.07% | 801,884 | |
| 18 Aug 2026 | 196,241 | 255,329 | -945 | -1,867 | ▲-59,088 | +922 | +1.54% | 24.38% | 31.72% | 804,940 | |
| 25 Aug 2026 | 198,919 | 235,271 | +2,678 | -20,058 | ▲-36,352 | +22,736 | +38.48% | 24.30% | 28.74% | 818,524 | |
| 1 Sep 2026 | 203,477 | 228,402 | +4,558 | -6,869 | ▲-24,925 | +11,427 | +31.43% | 23.51% | 26.39% | 865,412 | |
| 8 Sep 2026 | 198,509 | 241,125 | -4,968 | +12,723 | ▼-42,616 | -17,691 | -70.98% | 21.06% | 25.58% | 942,464 | |
| 15 Sep 2026 | 209,000 | 235,993 | +10,491 | -5,132 | ▲-26,993 | +15,623 | +36.66% | 22.72% | 25.65% | 920,035 | |
| 22 Sep 2026 | 220,708 | 273,042 | +11,708 | +37,049 | ▼-52,334 | -25,341 | -93.88% | 26.86% | 33.23% | 821,689 | |
 COT-ReportsGuide
How to Read the COT Reports — The Complete Guide
A step-by-step guide that teaches you to read and interpret the CFTC Commitments of Traders (COT) reports. Read it right here on the site — with live report examples that always match the current data. Built for retail traders, beginners welcome.
Premium also unlocks the Price column — daily settlement prices alongside positioning — plus CSV export and 20+ years of historical data, on every market and every report family.
Upgrade →* COT data sourced from the U.S. Commodity Futures Trading Commission (CFTC). Positions are captured as of Tuesday close and published the following Friday at 3:30 PM ET. Close Price reflects the settlement price on the report date, sourced from Yahoo Finance. Where no price is available (market holiday or unlisted instrument), the field shows "—". This data is provided for informational purposes only and does not constitute financial advice.
About the Simplified COT Report
Frequently Asked Questions
What is the Simplified COT Report?
The Simplified COT Report is a compact weekly table showing only Non-Commercial (large speculator) positions across all CFTC futures markets. It surfaces long, short, net positions and weekly changes in one view — designed for traders who track speculative positioning without the noise of commercial hedging activity.
What is Net Position in the Simplified COT?
Net Position equals Non-Commercial Long minus Non-Commercial Short contracts. A positive value means large speculators are collectively bullish (more long than short); a negative value means bearish. The weekly change column shows whether the speculative bias is strengthening or unwinding.
Who are Non-Commercials in the COT?
Non-Commercials are large speculative traders — primarily hedge funds, commodity trading advisors (CTAs) and proprietary trading firms — that hold reportable positions but do not use the futures market for commercial hedging. They are widely used as the speculative-sentiment proxy.
When is the next Simplified COT released?
The Simplified COT Report on this page is rebuilt every Friday at 3:30 PM Eastern Time the moment the CFTC releases new data. Positions reflect the previous Tuesday's close. When a US federal holiday falls on the Wednesday, Thursday or Friday of that week, the release moves to the next business day, usually the following Monday — a Monday holiday such as Labor Day does not delay it.
What's the difference between Simplified and Detailed?
The Simplified report shows only Non-Commercial positions (one trader category). The Detailed report shows all three categories — Non-Commercial, Commercial and Non-Reportable — with long, short, net and percentage of open interest for each. Simplified is faster to scan; Detailed gives the complete picture.
How are weekly reports aggregated when I group them?
When you switch the Group Reports filter from Individual to Bi-Weekly, Monthly, Quarterly, Half-Year or Yearly, the underlying weekly CFTC reports are combined as follows. Snapshot columns (Long, Short, Spreading, Open Interest) are averaged across the period — a monthly row shows the average position across the 4-5 weeks that fall inside that month. Flow columns (Change Long, Change Short, Change OI) are summed, because they represent weekly deltas and the period total is the cumulative flow. NET % CHANGE uses an endpoint formula: it compares the net position in the last week of the period to the net position in the first week, expressed as a percentage. The small ×N chip on the DATE cell shows exactly how many weekly reports were aggregated into that row.
Explore All Report Formats
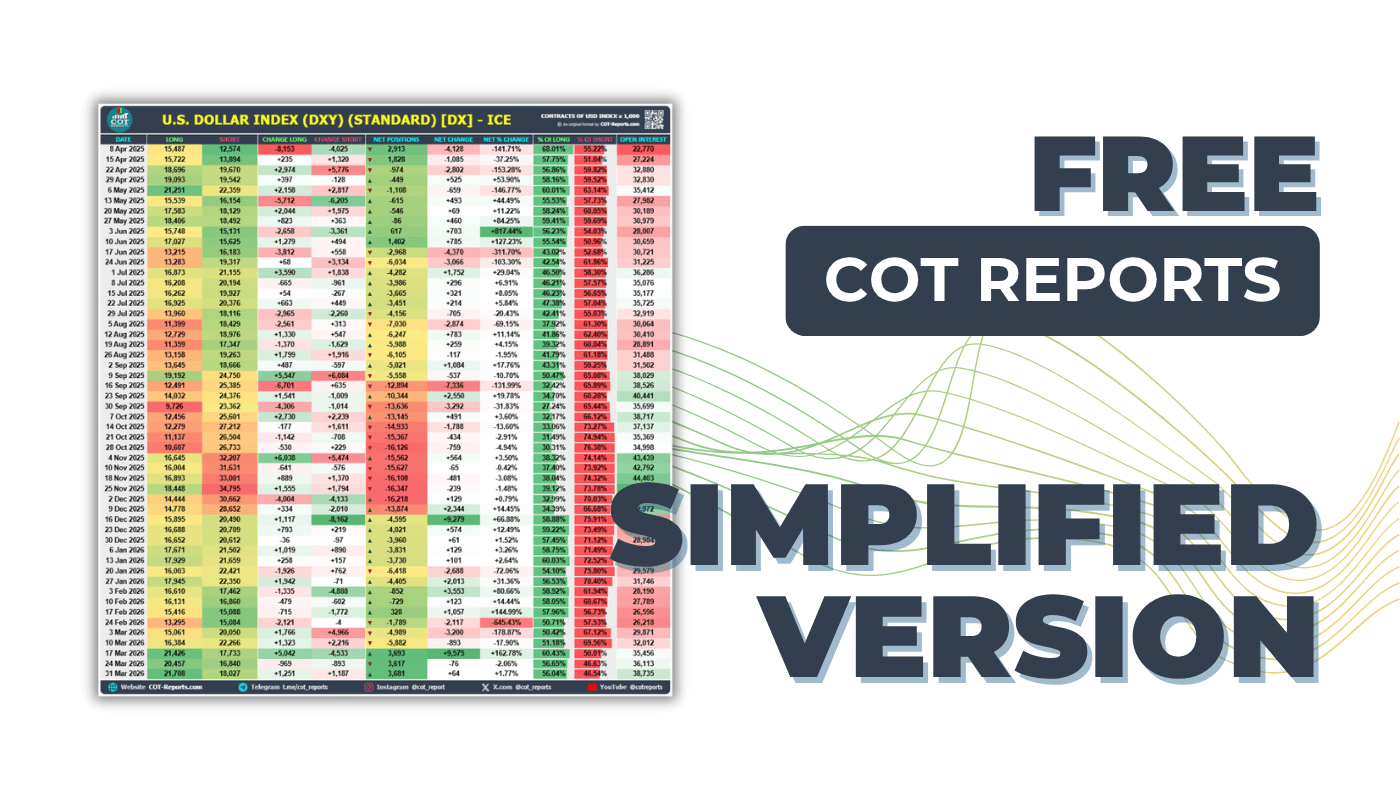
Simplified
Up to 10 years of weekly data per market with Non-Commercial, Commercial, and Non-Reportable positions.
View Simplified COT Report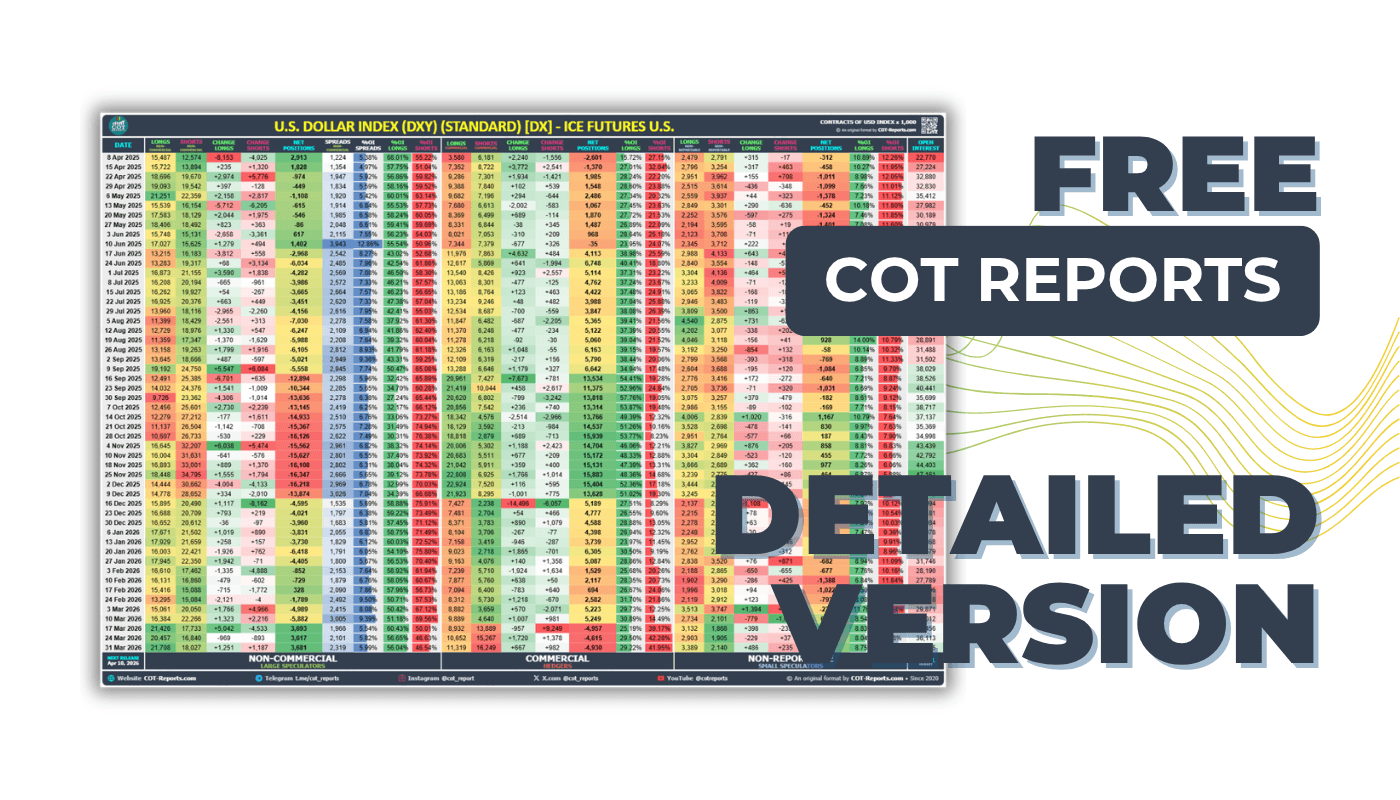
Detailed
Complete breakdown with Non-Commercial, Commercial, and Non-Reportable trader positions and changes.
View Detailed COT Report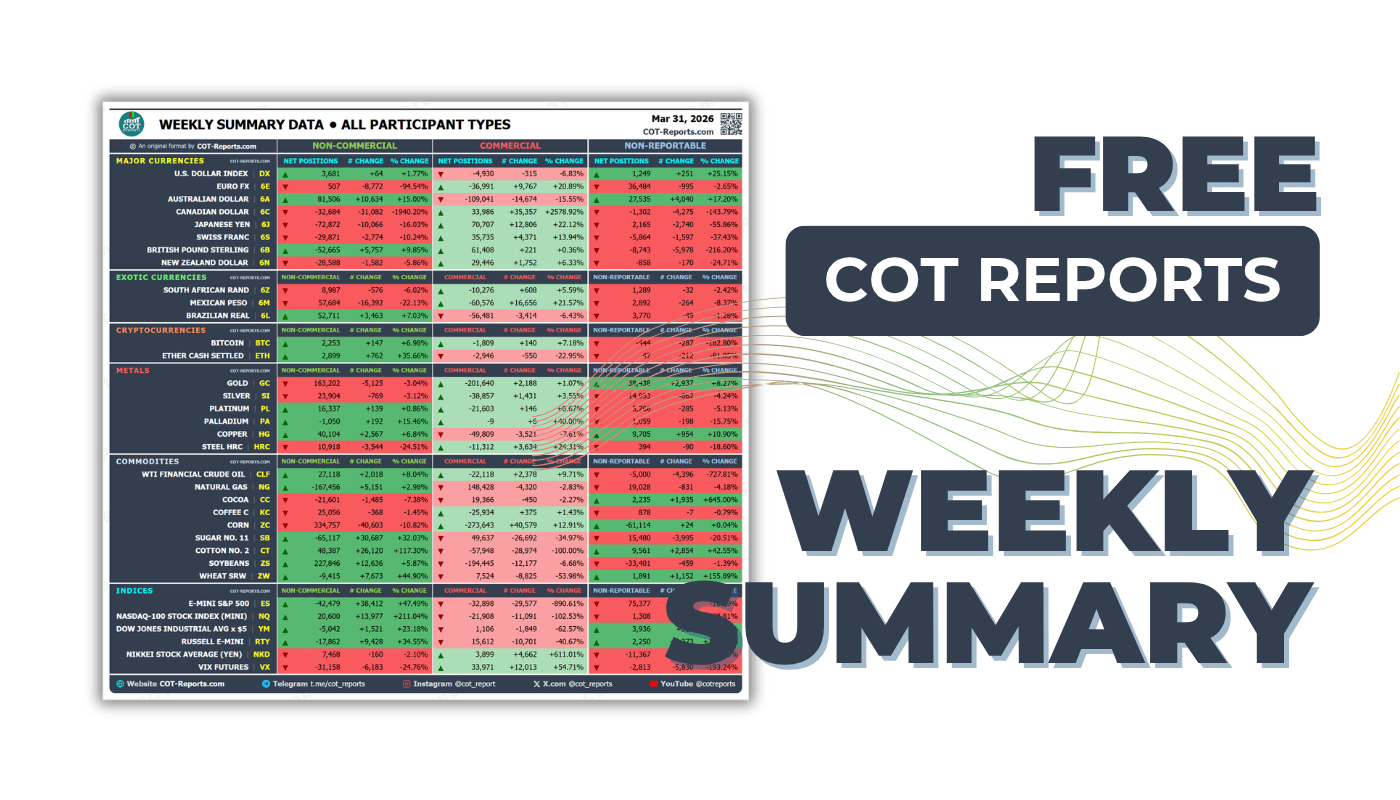
Weekly Summary
All positions at a glance. NET POSITIONS, % changes, and net/OI for all markets.
View Weekly Summary COT Report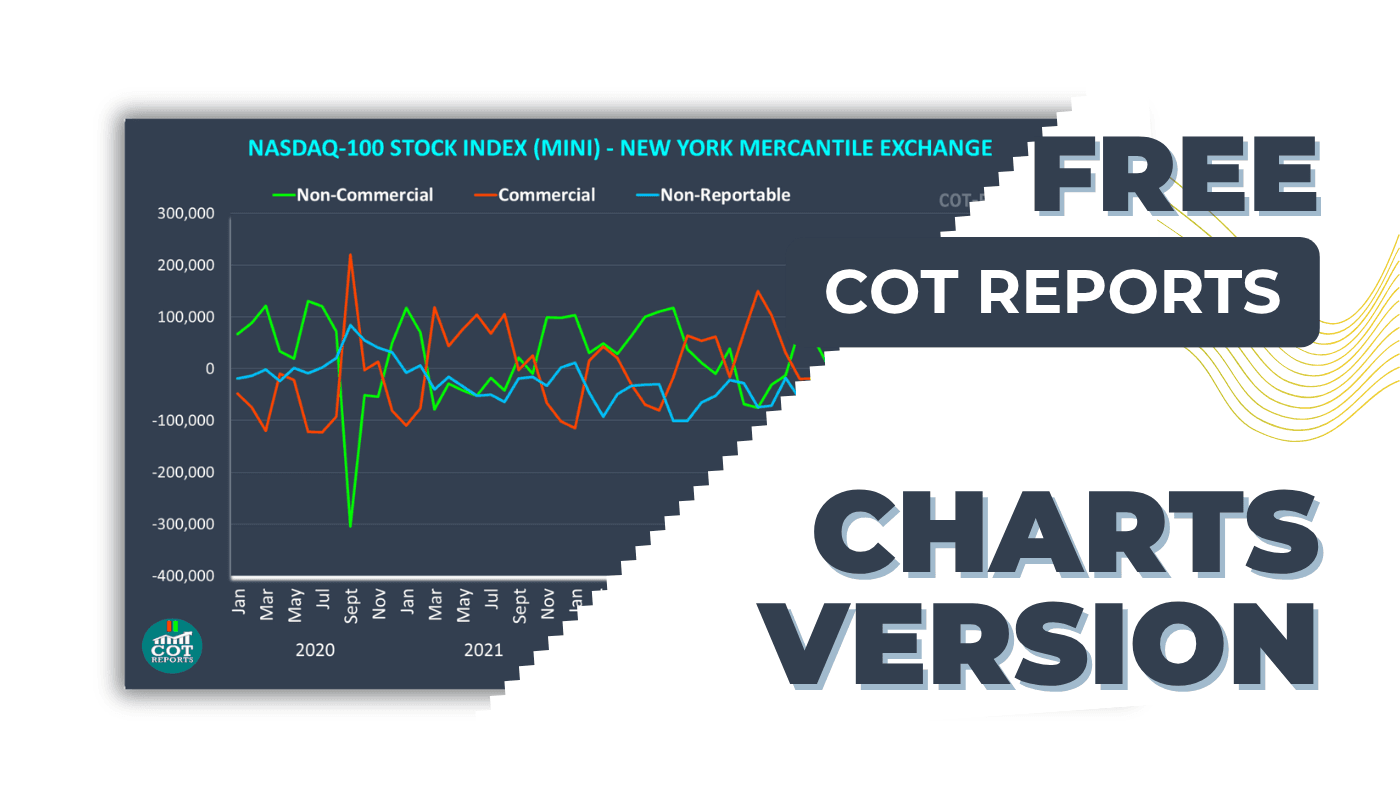
Charts
Visual COT data: Net positions over time, Long vs Short bars, and trend analysis.
View Charts COT ReportMore COT Report Formats
Unlock Every COT Report Format.
Every COT Report with Advanced Analytics
Go beyond the free reports: the Disaggregated, TFF and Supplemental formats with 20+ years of history, plus the Positioning Heatmap, Advanced Charts and CSV export.
CFTC REPORT FORMATS
- ✓+380 CFTC Markets — Every Commodity & Financial Future
- ✓Futures-Only Reports (Legacy)
- ✓Disaggregated Futures & Options Combined
- ✓Traders in Financial Futures (TFF)
- ✓Supplemental — Commodity Index Traders
DATA & TOOLS
- ✓20+ Years of Historical COT Data
- ✓Managed Money & Leveraged Funds Positioning
- ✓Download CSV Historical COT Data
- ✓Price Overlay on Charts
- ✓Extra COT Report Tables & Visualizations

Brokers
Start with twice the capital
Curated broker partners we know, use and recommend. Bonus offers, account transfers and live conditions reviewed by our team — not a random affiliate list.
 Exclusive Offer
100% First Deposit Bonus
Open a live account through COT-Reports and receive a VIP bonus credited directly to your MT4/MT5 trading account. This exclusive offer is not available on the official Ultima Markets website.
Get free access to TradeLog · 1 month free Premium with your first deposit
 Exclusive Offer
100% First Deposit Bonus
Open a live account through COT-Reports and receive a VIP bonus credited directly to your MT4/MT5 trading account. This exclusive offer is not available on the official Ultima Markets website.
Get free access to TradeLog · 1 month free Premium with your first deposit

 Any Prop Firm.
All your trading tools. One place.
Auto-sync trades from MetaTrader, NinjaTrader, cTrader, Tradovate and more. Built-in analytics, prop-firm tracking, risk management and multi-account support. Includes free EAs, free cBot and free NT Add-On.









 More
More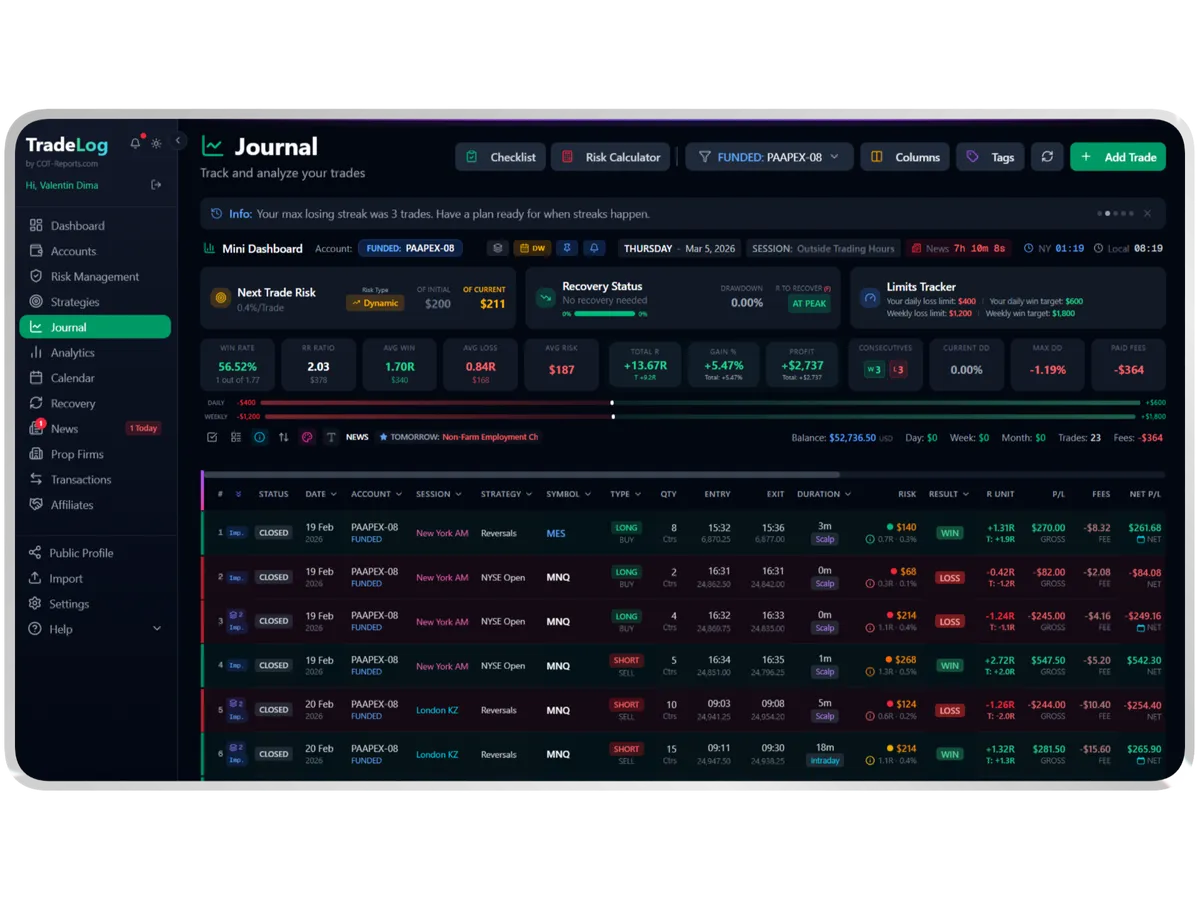
Join 12,000+ Traders on Telegram
Free COT reports delivered every Friday. Request reports on demand, track your trades, and access exclusive tools.