

Supplemental COT Report — Simplified
Index Traders · 13 ag markets · Updated every Friday
The CFTC's Supplemental Commodity Index Traders (CIT) view, isolating index-fund exposure across 13 agricultural markets — corn, wheat, soybeans, cotton, sugar and others. The only public dataset where commodity index ownership is broken out from speculator positioning.
The latest CFTC Commitments of Traders (COT) report (Supplemental) was released on Friday, 16 October 2026, reflecting futures positions as of the close of trading on Tuesday, 13 October 2026.
 CORNZC-CBOT
Premium Report
This report format is available exclusively for COT Premium subscribers.
- 9 premium report formats
- Heatmap
- Advanced Charts
- CSV export
- Price column
- 20+ years of data (since 2006, Legacy since 1986)
- Futures Only & Futures & Options Combined on every report and chart
Price column unlocked on every COT report table
Currently showing: CORN - CHICAGO BOARD OF TRADE | 26 reports | 21 Apr 2026 to 13 Oct 2026 · Variant: Futures & Options Combined
About the Supplemental COT Report
The Supplemental Commodity Index Traders (CIT) COT Report tracks three reportable categories — Non-Commercial, Commercial, Index Traders (commodity index funds) — across 13 agricultural futures markets. It is the only CFTC format that isolates commodity index fund positioning, released every Friday at 3:30 PM Eastern Time. The CFTC publishes it as Futures & Options Combined only.
- Source: U.S. Commodity Futures Trading Commission (CFTC)
- Release schedule: Every Friday, 3:30 PM ET (delayed on US federal holidays)
- Markets covered: 13 agricultural futures (grains, livestock, softs)
- Trader categories: Non-Commercial, Commercial, Index Traders
Frequently Asked Questions
What is the Supplemental COT Report?
The Supplemental Commodity Index Traders (CIT) COT Report is a weekly CFTC publication that covers 13 agricultural futures markets and uniquely breaks out Index Traders — commodity index funds such as those tracking the S&P GSCI or Bloomberg Commodity Index. The Supplemental format is the only COT report that isolates this category, making it essential for tracking index-fund flows into agriculture.
When is the Supplemental COT report released?
The CFTC releases the Supplemental COT report every Friday at 3:30 PM Eastern Time, reflecting positions as of the previous Tuesday's close. When a US federal holiday falls on the Wednesday, Thursday or Friday of that week, the release moves to the next business day, usually the following Monday — a Monday holiday such as Labor Day does not delay it.
What are Index Traders in the Supplemental report?
Index Traders are entities whose reported positions are predominantly driven by tracking a major commodity index such as the S&P GSCI (Goldman Sachs Commodity Index) or the Bloomberg Commodity Index (BCOM). They include index funds, exchange-traded funds (ETFs), and swap dealers hedging their index-linked swap exposure. Their positioning is usually passive and long-biased.
Which 13 markets are covered in the Supplemental report?
The Supplemental CIT report covers 13 agricultural futures markets: corn, wheat (Chicago and Kansas City), soybeans, soybean oil, soybean meal, live cattle, feeder cattle, lean hogs, cocoa, coffee, sugar #11, and cotton. These are the markets where commodity index funds have meaningful exposure.
How is Supplemental different from Disaggregated?
The Disaggregated report breaks Commercial traders into Producer/Merchant and Swap Dealers, and breaks Non-Commercial into Managed Money and Other Reportables — a finer breakdown for hedgers and speculators. The Supplemental report uses the traditional Non-Commercial / Commercial / Non-Reportable framework but adds Index Traders as a separate category. Most professional commodity analysts cross-reference both.
How are weekly reports aggregated when I group them?
When you switch the Group Reports filter from Individual to Bi-Weekly, Monthly, Quarterly, Half-Year or Yearly, the underlying weekly CFTC reports are combined as follows. Snapshot columns (Long, Short, Spreading, Open Interest) are averaged across the period — a monthly row shows the average position across the 4-5 weeks that fall inside that month. Flow columns (Change Long, Change Short, Change OI) are summed, because they represent weekly deltas and the period total is the cumulative flow. NET % CHANGE uses an endpoint formula: it compares the net position in the last week of the period to the net position in the first week, expressed as a percentage. The small ×N chip on the DATE cell shows exactly how many weekly reports were aggregated into that row.
Explore All Report Formats
Unlock Every COT Report Format.
Every COT Report with Advanced Analytics
Go beyond the free Legacy reports: the Disaggregated, TFF and Supplemental formats, custom date ranges back to 1986, the Positioning Heatmap, Advanced Charts and CSV export.
REPORTS & HISTORY
- ✓Disaggregated — Managed Money & Swap Dealers
- ✓Traders in Financial Futures (TFF) — Leveraged Funds & Asset Managers
- ✓Supplemental — Commodity Index Traders
- ✓Simplified, Detailed & Latest views of all three
- ✓Custom date ranges, back to 1986
- ✓Both CFTC variants of every report, one click apart
DATA & TOOLS
- ✓Close Price column & CSV export
- ✓Every trader group's figures on the Positioning Heatmap
- ✓Advanced Charts & COT Volume Profile
- ✓Custom Weekly Summary & My Markets
- ✓Table screenshots (PNG) with no daily limit
- ✓The complete How to Read the Simplified COT Report guide (3-month and annual plans)
The 3-month and 1-year plans include the How to Read the Simplified COT Report guide free.


 Any Prop Firm.
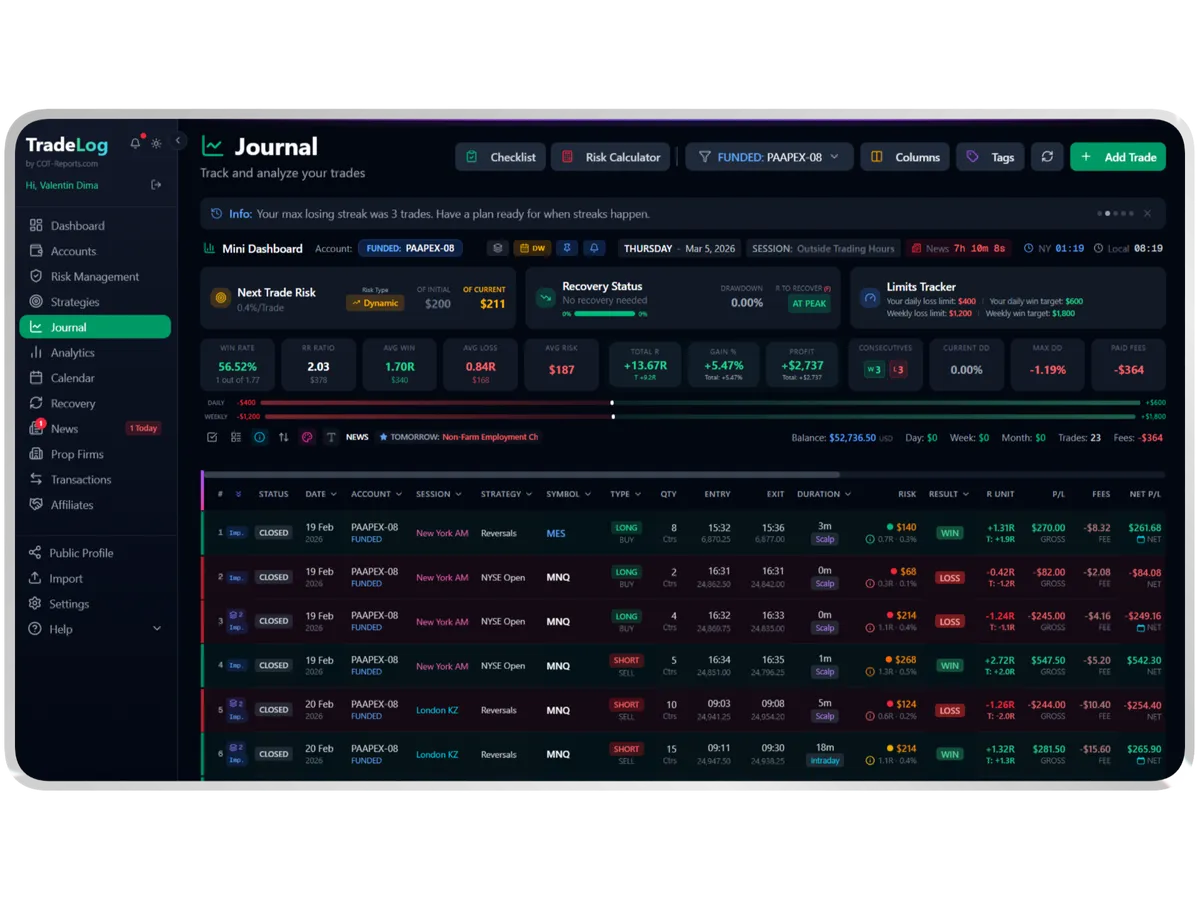
Automated Trading Journal
Auto-sync trades from MetaTrader, NinjaTrader, cTrader, Tradovate and more. Built-in analytics, prop-firm tracking, risk management and multi-account support. Basic and Premium include free EAs, a free cBot and a free NT Add-On.










COT-Reports Marketplace
Traders build it. Traders use it.
Probably the best trading tools, made by traders for the COT-Reports community. Buy what you need, or list what you built.
 COT-Reports.com
Every Friday, 35 markets land in Telegram. FREE.
The COT Report Simplified for each market in the map, plus the Weekly Summary, minutes after the CFTC publishes. Between Fridays, the bot sends any of them on request and keeps a free trading journal.