ICT and the COT Report: How the Inner Circle Trader Reads It
How ICT (Michael J. Huddleston) reads the CFTC COT report: commercials first, the hedging program, Futures Only data — and where to follow it on our site.
ichael J. Huddleston, known to traders worldwide as ICT — The Inner Circle Trader — has shared an unusually large body of trading education for free on his YouTube channel. Among those lessons is one dedicated entirely to the CFTC Commitments of Traders report, and the way he reads it is simple enough to follow week after week.
This article covers what he has made available to the trading community, what his COT lesson teaches (in our own words), where to find his official channels, and how to follow the same data on COT-Reports.com. COT-Reports.com is not affiliated with ICT / Michael J. Huddleston; his name is used only to describe his published lessons.
What ICT has shared with the trading community
His YouTube channel, The Inner Circle Trader, has been on YouTube since 2012 and counts more than two million subscribers. Its playlists include the 2016–2017 Private Mentorship Core Content — lectures first given to private students and later published openly on the channel, which says he shared them freely so that nobody could resell them — followed by yearly mentorship series from 2022 onward.
Many of the ideas traders now associate with his name have a dedicated lesson there, from Fair Value Gaps and Optimal Trade Entry to Order Blocks and the Silver Bullet time-based model. All of them are free to watch.
The COT lesson: Month 10 of the Core Content
His dedicated COT lesson is “ICT Mentorship Core Content — Month 10 — Commitment Of Traders”, published on his channel on 16 October 2022 from the June 2017 lectures (about 35 minutes). The video owner has turned off embedding, so it is linked below rather than played on this page — it opens on YouTube.
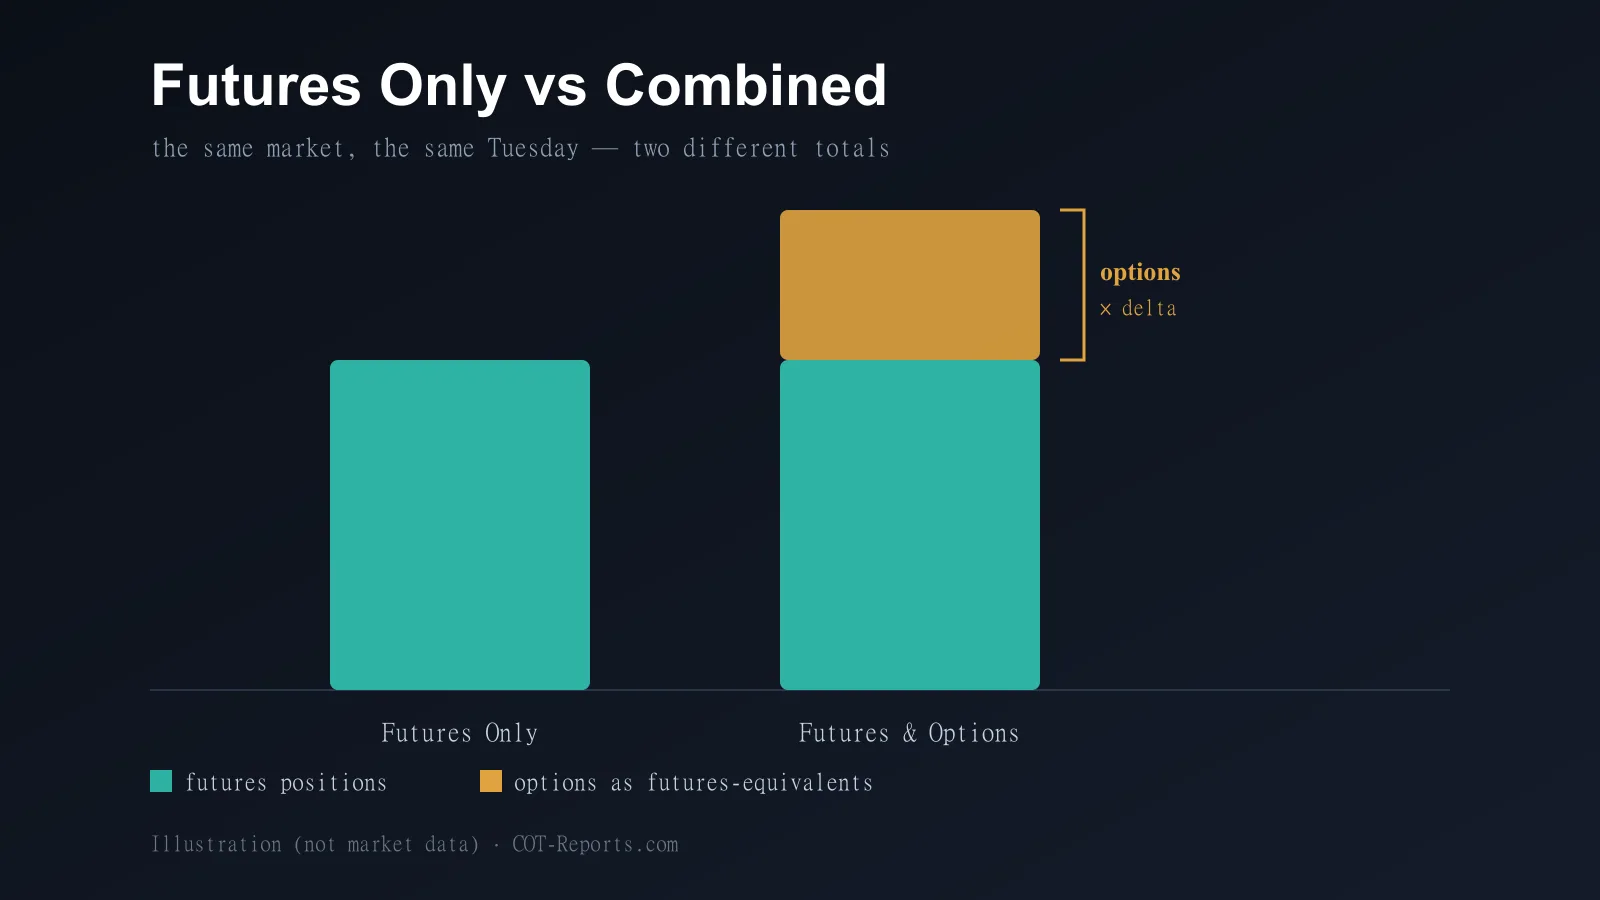
In the lesson he credits Larry Williams as his mentor on COT data — whose COT Index approach we cover in a separate article on this blog. The data he uses is the weekly CFTC report in its futures-only, short format: he leaves the options positions aside.
Commercials first
His focus is the commercials — producers and users of a market who hedge it, like a chocolate maker buying cocoa ahead of time to lock in a price. Their net position is simply their long contracts minus their short contracts.
He reads the other two groups mostly in relation to them: large speculators are often positioned against the commercials, and small speculators he treats as the less informed crowd. In practice, the line he follows on the chart is the commercials’.
Buy program, sell program, hedging program
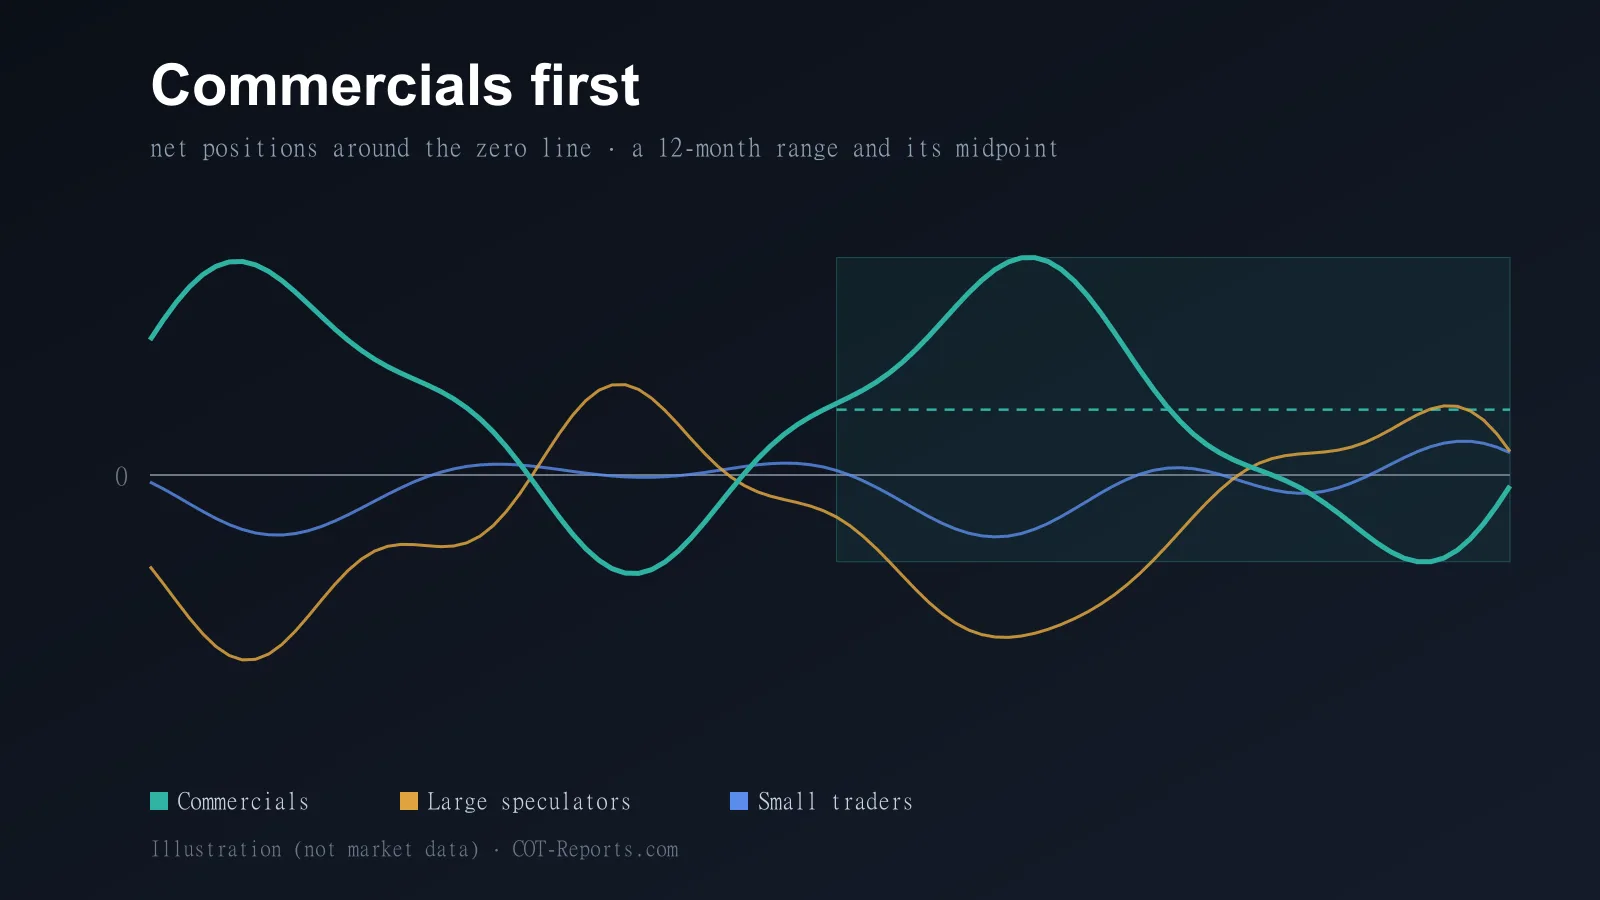
The first read is the zero line: commercials net long means they are in a buy program, net short a sell program. On its own, he explains, the raw net figure says little about what they are doing right now.
So he adds a second read, the “hedging program”: take the highest and the lowest commercial net position of the last six and twelve months, treat that range as the new reference, and split it in half. Where this week’s reading sits within that range shows how the commercials are leaning compared with their own recent behaviour.
He also watches for extremes over longer windows — twelve months, two years, four years — which he says tend to come around long-term turning points. He does not use the COT read alone: he blends it with his price-based analysis. In a separate 2017 video he adds two cautions: a move across the zero line is not, by itself, a change of direction, and an extreme does not mean the turn happens at once.
How to follow it on COT-Reports.com
The COT Data Charts page is open to everyone, for every CFTC market, with ranges from 1Y to 10Y plus the full history. It plots the net positions of the Non-Commercial (large speculators), Commercial and Non-Reportable (small traders) groups against a zero line — the buy-program / sell-program view. Its default data is Futures Only, the same version he uses; Futures & Options Combined is a Premium option.
For the hedging-program read, the COT Index page does the range arithmetic for you: choose the Commercial (Hedgers) category, and the 26W and 52W lookbacks show where this week’s net position sits inside its six- and twelve-month range on a 0–100 scale, with 50 as the midpoint. Both are free; the longer 156W (3Y) and 260W (5Y) lookbacks need a free account. The COT Report Simplified and Detailed tables give the weekly numbers behind both.
Where to find his lessons
ICT’s official YouTube channel is @InnerCircleTrader, his official X account is @I_Am_The_ICT, and his website is theinnercircletrader.com — the links are in the sources below. The channel’s About page links to the X account, and that account links back to the website.
This article is educational and is not trading advice. The COT report shows Tuesday’s positions and is normally released on Friday, so it describes the market a few days late; any method built on it is a way to read positioning, not a forecast.
Sources and official channels
- The Inner Circle Trader — official YouTube channel (@InnerCircleTrader)
- The Inner Circle Trader — official X account (@I_Am_The_ICT)
- The Inner Circle Trader — official website
- ICT Mentorship Core Content — Month 10 — Commitment Of Traders (YouTube, published 16 Oct 2022)
- ICT Forex — COT Insights For Effective Price Action Analysis (YouTube, 22 Dec 2017)
- ICT — the channel’s playlists (Core Content 2016–2017, yearly mentorships)
- CFTC — Commitments of Traders reports
COT-Reports.com is not affiliated with ICT / Michael J. Huddleston. His name and lessons are cited here for information only.